

2006 Annual Report - Fiat SpA
2006 Annual Report - Fiat SpA
2006 Annual Report - Fiat SpA

Create successful ePaper yourself
Turn your PDF publications into a flip-book with our unique Google optimized e-Paper software.
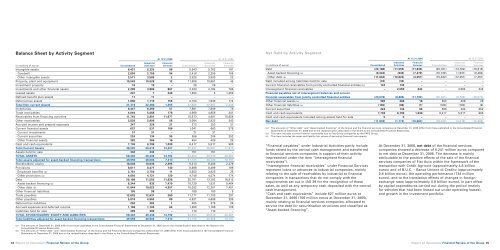
Balance Sheet by Activity Segment<br />
At 12.31.<strong>2006</strong> At 12.31.2005<br />
Industrial Financial Industrial Financial<br />
(in millions of euros) Consolidated Activities Services Consolidated Activities Services<br />
Intangible assets 6,421 6,325 96 5,943 5,762 181<br />
- Goodwill 2,850 2,756 94 2,418 2,259 159<br />
- Other intangible assets 3,571 3,569 2 3,525 3,503 22<br />
Property, plant and equipment 10,540 10,528 12 11,006 10,961 45<br />
Investment property 19 19 – 26 26 –<br />
Investments and other financial assets 2,280 3,886 867 2,333 4,184 796<br />
Leased assets 247 7 240 1,254 4 1,250<br />
Defined benefit plan assets 11 11 – – – –<br />
Deferred tax assets 1,860 1,710 150 2,104 1,930 174<br />
Total Non-current Assets 21,378 22,486 1,365 22,666 22,867 2,446<br />
Inventories 8,447 8,390 57 7,881 7,809 76<br />
Trade receivables 4,944 5,068 178 4,969 4,856 341<br />
Receivables from financing activities 11,743 2,891 11,977 15,973 4,881 15,856<br />
Other receivables 2,839 2,806 58 3,084 2,922 243<br />
Accrued income and prepaid expenses 247 226 21 272 253 21<br />
Current financial assets 637 531 106 1,041 663 378<br />
- Current investments 31 31 – 31 31 –<br />
- Current securities 224 134 90 556 204 352<br />
- Other financial assets 382 366 16 454 428 26<br />
Cash and cash equivalents 7,736 6,706 1,030 6,417 5,517 900<br />
Total Current Assets 36,593 26,618 13,427 39,637 26,901 17,815<br />
Assets held for sale 332 332 – 151 151 –<br />
TOTAL ASSETS 58,303 49,436 14,792 62,454 49,919 20,261<br />
Total assets adjusted for asset-backed financing transactions 49,959 48,504 7,313 51,725 48,388 10,797<br />
Stockholders’ equity 10,036 10,036 2,395 9,413 9,409 2,479<br />
Provisions 8,611 8,471 140 8,698 8,499 199<br />
- Employee benefits (a) 3,761 3,750 11 3,950 3,925 25<br />
- Other provisions (a) 4,850 4,721 129 4,748 4,574 174<br />
Debt 20,188 11,555 11,836 25,761 13,782 16,915<br />
- Asset-backed financing (b) 8,344 932 7,479 10,729 1,531 9,464<br />
- Other debt (b) 11,844 10,623 4,357 15,032 12,251 7,451<br />
Other financial liabilities 105 98 7 189 180 9<br />
Trade payables 12,603 12,637 260 11,777 11,700 297<br />
Other payables 5,019 4,963 89 4,821 4,698 205<br />
Deferred tax liabilities 263 262 1 405 375 29<br />
Accrued expenses and deferred income 1,169 1,105 64 1,280 1,166 128<br />
Liabilities held for sale 309 309 – 110 110 –<br />
TOTAL STOCKHOLDERS’ EQUITY AND LIABILITIES 58,303 49,436 14,792 62,454 49,919 20,261<br />
Total liabilities adjusted for asset-backed financing transactions 49,959 48,504 7,313 51,725 48,388 10,797<br />
(a) The amounts at December 31, 2005 differ from those published in the Consolidated Financial Statements at December 31, 2005 due to the reclassification described in the Notes to the<br />
Consolidated Financial Statements.<br />
(b) The amounts of “Other debt” and “Asset-backed financing” of the Group and the Financial Services Companies at December 31, 2005 differ from those published in the Consolidated Financial<br />
Statements at December 31, 2005 due to the reclassification described in the Notes to the Consolidated Financial Statements.<br />
44 <strong>Report</strong> on Operations Financial Review of the Group<br />
Net Debt by Activity Segment<br />
At 12.31.<strong>2006</strong> At 12.31.2005<br />
Industrial Financial Industrial Financial<br />
(in millions of euros) Consolidated Activities Services Consolidated Activities Services<br />
Debt (20,188) (11,555) (11,836) (25,761) (13,782) (16,915)<br />
- Asset-backed financing (a) (8,344) (932) (7,479) (10,729) (1,531) (9,464)<br />
- Other debt (a) (11,844) (10,623) (4,357) (15,032) (12,251) (7,451)<br />
Debt included among liabilities held for sale (33) (33) – – – –<br />
Current financial receivables from jointly controlled financial entities (b) 143 143 – – – –<br />
Intersegment financial receivables – 2,559 644 – 4,594 342<br />
Financial payables net of intersegment balances and current<br />
financial receivables from jointly controlled financial entities (20,078) (8,886) (11,192) (25,761) (9,188) (16,573)<br />
Other financial assets (c) 382 366 16 454 428 26<br />
Other financial liabilities (c) (105) (98) (7) (189) (180) (9)<br />
Current securities 224 134 90 556 204 352<br />
Cash and cash equivalents 7,736 6,706 1,030 6,417 5,517 900<br />
Cash and cash equivalents included among assets held for sale 5 5 – – – –<br />
Net debt (11,836) (1,773) (10,063) (18,523) (3,219) (15,304)<br />
(a) The amounts of “Other debt” and “Asset-backed financing” of the Group and the financial services companies at December 31, 2005 differ from those published in the Consolidated Financial<br />
Statements at December 31, 2005 due to the reclassification described in the Notes to the Consolidated Financial Statements.<br />
(b) This item includes current financial receivables due to <strong>Fiat</strong> Group companies by the FAFS Group.<br />
(c) This item includes the asset and liability fair values of derivative financial instruments.<br />
“Financial payables” under Industrial Activities partly include<br />
funds raised by the central cash management and transferred<br />
to financial services companies in support of their activity<br />
(represented under the item “Intersegment financial<br />
receivables”).<br />
“Intersegment financial receivables” under Financial Services<br />
represent loans or advances to industrial companies, mainly<br />
relating to the sale of receivables by industrial to financial<br />
companies in transactions that do not comply with the<br />
requirements set out in IAS 39 for the recognition of those<br />
sales, as well as any temporary cash deposited with the central<br />
cash management.<br />
“Cash and cash equivalents” include 627 million euros at<br />
December 31, <strong>2006</strong> (706 million euros at December 31, 2005),<br />
mainly relating to financial services companies, allocated to<br />
service the debt for securitisation structures and classified as<br />
“Asset-backed financing”.<br />
At December 31, <strong>2006</strong>, net debt of the financial services<br />
companies showed a decrease of 5,241 million euros compared<br />
to net debt at December 31, 2005. The decrease is mainly<br />
attributable to the positive effects of the sale of the financial<br />
services companies of <strong>Fiat</strong> Auto within the framework of the<br />
transaction with Crédit Agricole (approximately 4.8 billion<br />
euros) and of B.U.C. – Banca Unione di Credito (approximately<br />
0.8 billion euros), the operating performance (734 million<br />
euros), and to the translation effects of changes in foreign<br />
exchange rates (approximately 0.8 billion euros), in part offset<br />
by capital expenditures carried out during the period (mainly<br />
for vehicles that had been leased out under operating leases),<br />
and growth in the investment portfolio.<br />
<strong>Report</strong> on Operations Financial Review of the Group 45


