READIT - 2009 - Indira Gandhi Centre for Atomic Research
READIT - 2009 - Indira Gandhi Centre for Atomic Research
READIT - 2009 - Indira Gandhi Centre for Atomic Research

Create successful ePaper yourself
Turn your PDF publications into a flip-book with our unique Google optimized e-Paper software.
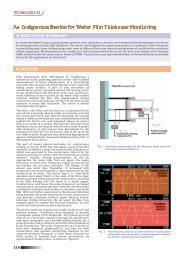
Proceedings of <strong>READIT</strong>-<strong>2009</strong>, Kalpakkam - 603 102, 29-30 Dec <strong>2009</strong><br />
<br />
<br />
Save physical storage space<br />
Can support multimedia in<strong>for</strong>mation<br />
4. OBJECTIVES<br />
The main objectives of the study are:<br />
To ascertain the awareness of e-journals among the users of engineering institutions in<br />
Karur district.<br />
To measure the frequency of access to digital library<br />
To assess the use pattern and preference of e-journals by the users<br />
To know the satisfaction level of current e-journals available in library<br />
To know the problems faced by the users in accessing the e-resources.To draw<br />
opinions and suggestions from the users regarding betterment and development of the<br />
e-resources service.<br />
5. METHODOLOGY<br />
The study adopted a descriptive survey method and employed a questionnaire as the<br />
data collection tool. There are 3 engineering colleges in Karur district.<br />
1. M. Kumarasamy College of Engineering & Technology (2000)<br />
2. VSB Engineering College (2002)<br />
3. Chettinadu college of Engineering & Technology (2007)<br />
The above engineering colleges have good collection of e-resources in there digital<br />
library. All the 3 engineering college of Karur district under study were visited personally to<br />
collect data from the library. The user community was divided in to 2 types: Faculty and<br />
Students. An equal number of 75 questionnaires was circulated among the users of 3 colleges.<br />
Out of 225 questionnaires distributed, 183 respondents returned filled in questionnaire. The<br />
response rate there<strong>for</strong>e accounts <strong>for</strong> 81.3%. Thus, the rest of the analysis is based on the 183<br />
coded filled in questionnaires.<br />
6. ANALYSIS AND INTERPRETATION<br />
Table 1 Demographic characteristics of respondents<br />
S.No. Demography of Respondents (n=183) Total no. of Percentage<br />
Response<br />
1. Gender Male 96 52.5<br />
Female 87 47.5<br />
2. Age < 25 103 56.2<br />
26-35 49 26.8<br />
>36 31 17<br />
3. Discipline Engineering 115 62.8<br />
Computer Applications/ IT 31 16.9<br />
Management studies 37 20.2<br />
4. Designation Faculty 52 28.4<br />
Students 131 71.6<br />
48