

School of Engineering and Science - Jacobs University
School of Engineering and Science - Jacobs University
School of Engineering and Science - Jacobs University

You also want an ePaper? Increase the reach of your titles
YUMPU automatically turns print PDFs into web optimized ePapers that Google loves.
384 B.W. Alex<strong>and</strong>er et al. / Geochimica et Cosmochimica Acta 72 (2008) 378–394<br />
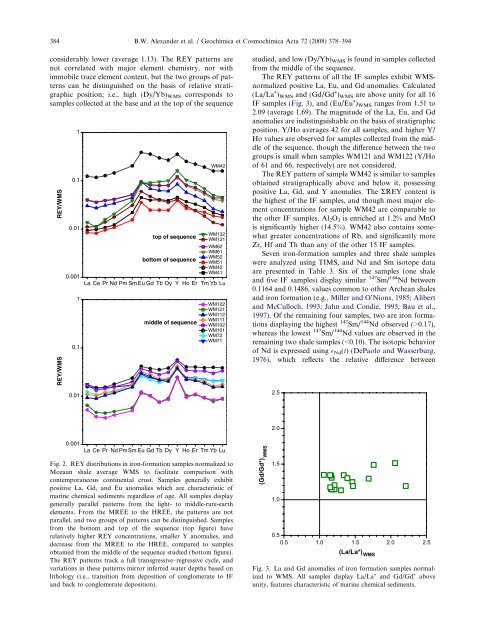
considerably lower (average 1.13). The REY patterns are<br />
not correlated with major element chemistry, nor with<br />
immobile trace element content, but the two groups <strong>of</strong> patterns<br />
can be distinguished on the basis <strong>of</strong> relative stratigraphic<br />
position; i.e., high (Dy/Yb) WMS corresponds to<br />
samples collected at the base <strong>and</strong> at the top <strong>of</strong> the sequence<br />
REY/WMS<br />
REY/WMS<br />
1<br />
0.1<br />
0.01<br />
0.001<br />
1<br />
0.1<br />
0.01<br />
top <strong>of</strong> sequence<br />
bottom <strong>of</strong> sequence<br />
La Ce Pr Nd Pm Sm Eu Gd Tb Dy Y Ho Er Tm Yb Lu<br />
middle <strong>of</strong> sequence<br />
WM42<br />
WM132<br />
WM131<br />
WM62<br />
WM61<br />
WM52<br />
WM51<br />
WM42<br />
WM41<br />
WM122<br />
WM121<br />
WM112<br />
WM111<br />
WM102<br />
WM101<br />
WM72<br />
WM71<br />
studied, <strong>and</strong> low (Dy/Yb) WMS is found in samples collected<br />
from the middle <strong>of</strong> the sequence.<br />
The REY patterns <strong>of</strong> all the IF samples exhibit WMSnormalized<br />
positive La, Eu, <strong>and</strong> Gd anomalies. Calculated<br />
(La/La * ) WMS <strong>and</strong> (Gd/Gd * ) WMS are above unity for all 16<br />
IF samples (Fig. 3), <strong>and</strong> (Eu/Eu * ) WMS ranges from 1.51 to<br />
2.09 (average 1.69). The magnitude <strong>of</strong> the La, Eu, <strong>and</strong> Gd<br />
anomalies are indistinguishable on the basis <strong>of</strong> stratigraphic<br />
position. Y/Ho averages 42 for all samples, <strong>and</strong> higher Y/<br />
Ho values are observed for samples collected from the middle<br />
<strong>of</strong> the sequence, though the difference between the two<br />
groups is small when samples WM121 <strong>and</strong> WM122 (Y/Ho<br />
<strong>of</strong> 61 <strong>and</strong> 66, respectively) are not considered.<br />
The REY pattern <strong>of</strong> sample WM42 is similar to samples<br />
obtained stratigraphically above <strong>and</strong> below it, possessing<br />
positive La, Gd, <strong>and</strong> Y anomalies. The RREY content is<br />
the highest <strong>of</strong> the IF samples, <strong>and</strong> though most major element<br />
concentrations for sample WM42 are comparable to<br />
the other IF samples, Al 2 O 3 is enriched at 1.2% <strong>and</strong> MnO<br />
is significantly higher (14.5%). WM42 also contains somewhat<br />
greater concentrations <strong>of</strong> Rb, <strong>and</strong> significantly more<br />
Zr, Hf <strong>and</strong> Th than any <strong>of</strong> the other 15 IF samples.<br />
Seven iron-formation samples <strong>and</strong> three shale samples<br />
were analyzed using TIMS, <strong>and</strong> Nd <strong>and</strong> Sm isotope data<br />
are presented in Table 3. Six <strong>of</strong> the samples (one shale<br />
<strong>and</strong> five IF samples) display similar 147 Sm/ 144 Nd between<br />
0.1164 <strong>and</strong> 0.1486, values common to other Archean shales<br />
<strong>and</strong> iron formation (e.g., Miller <strong>and</strong> O’Nions, 1985; Alibert<br />
<strong>and</strong> McCulloch, 1993; Jahn <strong>and</strong> Condie, 1995; Bau et al.,<br />
1997). Of the remaining four samples, two are iron formations<br />
displaying the highest 147 Sm/ 144 Nd observed (>0.17),<br />
whereas the lowest 147 Sm/ 144 Nd values are observed in the<br />
remaining two shale samples (


