School of Engineering and Science - Jacobs University
School of Engineering and Science - Jacobs University
School of Engineering and Science - Jacobs University
You also want an ePaper? Increase the reach of your titles
YUMPU automatically turns print PDFs into web optimized ePapers that Google loves.
solution, etc., are considered, the total amount <strong>of</strong> time necessary to measure any<br />
single solution is ~10 minutes.<br />
4.4. Internal st<strong>and</strong>ardization<br />
After an ICPMS analysis, the raw data in cps are transferred to an Excel<br />
spreadsheet for the application <strong>of</strong> three separate mathematical corrections. These<br />
corrections are applied to all analytical solutions (blanks, calibration st<strong>and</strong>ards,<br />
samples) in the following order: 1) internal st<strong>and</strong>ard corrections; 2) corrections for<br />
interfering polyatomic species; <strong>and</strong> 3) blank corrections. The internal st<strong>and</strong>ard (IS)<br />
correction using 101 Ru, 187 Re, <strong>and</strong> 209 Bi follows the method <strong>of</strong> Doherty (1989). The<br />
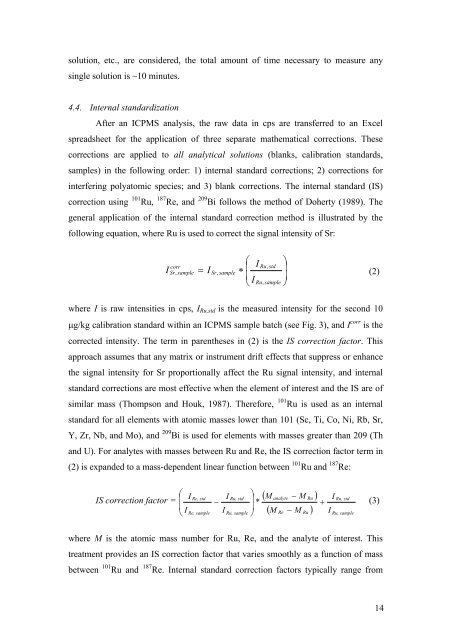
general application <strong>of</strong> the internal st<strong>and</strong>ard correction method is illustrated by the<br />
following equation, where Ru is used to correct the signal intensity <strong>of</strong> Sr:<br />
I<br />
⎛ ⎞<br />
⎜ I Ru,<br />
std<br />
= ∗ ⎟<br />
, sample I Sr,<br />
sample<br />
(2)<br />
⎜ ⎟<br />
⎝ I Ru,<br />
sample ⎠<br />
corr<br />
Sr<br />
where I is raw intensities in cps, I Ru,std is the measured intensity for the second 10<br />
μg/kg calibration st<strong>and</strong>ard within an ICPMS sample batch (see Fig. 3), <strong>and</strong> I corr is the<br />
corrected intensity. The term in parentheses in (2) is the IS correction factor. This<br />
approach assumes that any matrix or instrument drift effects that suppress or enhance<br />
the signal intensity for Sr proportionally affect the Ru signal intensity, <strong>and</strong> internal<br />
st<strong>and</strong>ard corrections are most effective when the element <strong>of</strong> interest <strong>and</strong> the IS are <strong>of</strong><br />
similar mass (Thompson <strong>and</strong> Houk, 1987). Therefore, 101 Ru is used as an internal<br />
st<strong>and</strong>ard for all elements with atomic masses lower than 101 (Sc, Ti, Co, Ni, Rb, Sr,<br />
Y, Zr, Nb, <strong>and</strong> Mo), <strong>and</strong> 209 Bi is used for elements with masses greater than 209 (Th<br />
<strong>and</strong> U). For analytes with masses between Ru <strong>and</strong> Re, the IS correction factor term in<br />
(2) is exp<strong>and</strong>ed to a mass-dependent linear function between 101 Ru <strong>and</strong> 187 Re:<br />
IS correction factor =<br />
⎛<br />
⎜ I<br />
⎜<br />
⎝ I<br />
Re, std<br />
Re, sample<br />
Ru, sample<br />
( M analyte − M Ru ) I Ru, std<br />
+<br />
( M Re − M Ru ) I Ru, sample<br />
Ru, std<br />
− * (3)<br />
I<br />
I<br />
⎞<br />
⎟<br />
⎟<br />
⎠<br />
where M is the atomic mass number for Ru, Re, <strong>and</strong> the analyte <strong>of</strong> interest. This<br />
treatment provides an IS correction factor that varies smoothly as a function <strong>of</strong> mass<br />
between 101 Ru <strong>and</strong> 187 Re. Internal st<strong>and</strong>ard correction factors typically range from<br />
14


