

School of Engineering and Science - Jacobs University
School of Engineering and Science - Jacobs University
School of Engineering and Science - Jacobs University

You also want an ePaper? Increase the reach of your titles
YUMPU automatically turns print PDFs into web optimized ePapers that Google loves.
1.50 FeR-4 (n=2)<br />
1.25<br />
JUB / reference average<br />
1.00<br />
0.75<br />
0.50<br />
0.25<br />
0.00<br />
Sc Ti Co Ni Rb Sr Y Zr Nb Mo Cs Ba La Ce Pr Nd Sm Eu Gd Tb Dy Ho Er Tm Yb Lu Hf Ta W Pb Th U<br />
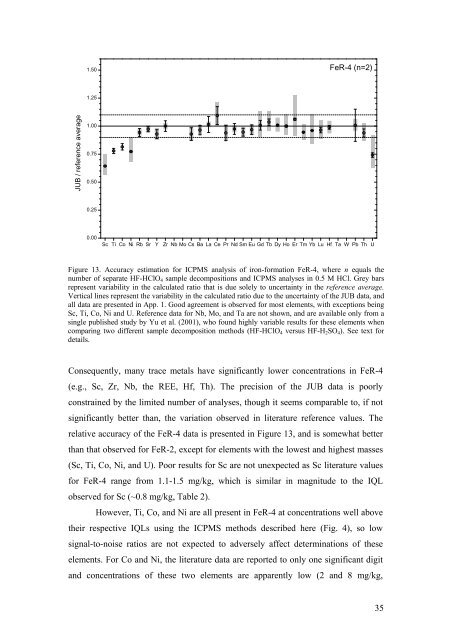
Figure 13. Accuracy estimation for ICPMS analysis <strong>of</strong> iron-formation FeR-4, where n equals the<br />
number <strong>of</strong> separate HF-HClO 4 sample decompositions <strong>and</strong> ICPMS analyses in 0.5 M HCl. Grey bars<br />
represent variability in the calculated ratio that is due solely to uncertainty in the reference average.<br />
Vertical lines represent the variability in the calculated ratio due to the uncertainty <strong>of</strong> the JUB data, <strong>and</strong><br />
all data are presented in App. 1. Good agreement is observed for most elements, with exceptions being<br />
Sc, Ti, Co, Ni <strong>and</strong> U. Reference data for Nb, Mo, <strong>and</strong> Ta are not shown, <strong>and</strong> are available only from a<br />
single published study by Yu et al. (2001), who found highly variable results for these elements when<br />
comparing two different sample decomposition methods (HF-HClO 4 versus HF-H 2 SO 4 ). See text for<br />
details.<br />
Consequently, many trace metals have significantly lower concentrations in FeR-4<br />
(e.g., Sc, Zr, Nb, the REE, Hf, Th). The precision <strong>of</strong> the JUB data is poorly<br />
constrained by the limited number <strong>of</strong> analyses, though it seems comparable to, if not<br />
significantly better than, the variation observed in literature reference values. The<br />
relative accuracy <strong>of</strong> the FeR-4 data is presented in Figure 13, <strong>and</strong> is somewhat better<br />
than that observed for FeR-2, except for elements with the lowest <strong>and</strong> highest masses<br />
(Sc, Ti, Co, Ni, <strong>and</strong> U). Poor results for Sc are not unexpected as Sc literature values<br />
for FeR-4 range from 1.1-1.5 mg/kg, which is similar in magnitude to the IQL<br />
observed for Sc (~0.8 mg/kg, Table 2).<br />
However, Ti, Co, <strong>and</strong> Ni are all present in FeR-4 at concentrations well above<br />
their respective IQLs using the ICPMS methods described here (Fig. 4), so low<br />
signal-to-noise ratios are not expected to adversely affect determinations <strong>of</strong> these<br />
elements. For Co <strong>and</strong> Ni, the literature data are reported to only one significant digit<br />
<strong>and</strong> concentrations <strong>of</strong> these two elements are apparently low (2 <strong>and</strong> 8 mg/kg,<br />
35


