

School of Engineering and Science - Jacobs University
School of Engineering and Science - Jacobs University
School of Engineering and Science - Jacobs University

You also want an ePaper? Increase the reach of your titles
YUMPU automatically turns print PDFs into web optimized ePapers that Google loves.
1.50 IF-G (n=2)<br />
1.25<br />
JUB / reference average<br />
1.00<br />
0.75<br />
0.50<br />
0.25<br />
0.00<br />
Sc Ti Co Ni Rb Sr Y Zr Nb Mo Cs Ba La Ce Pr Nd Sm Eu Gd Tb Dy Ho Er Tm Yb Lu Hf Ta W Pb Th U<br />
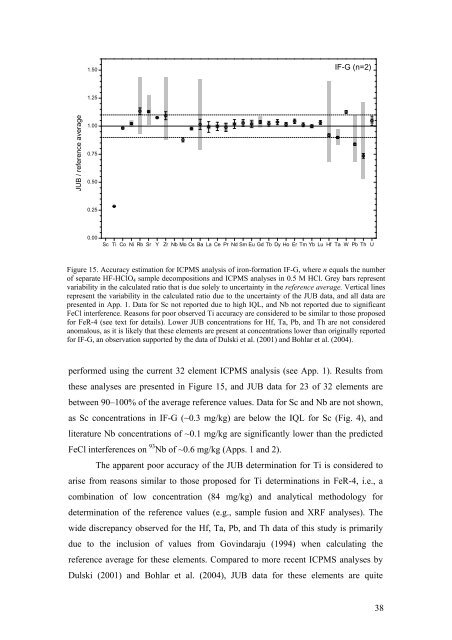
Figure 15. Accuracy estimation for ICPMS analysis <strong>of</strong> iron-formation IF-G, where n equals the number<br />
<strong>of</strong> separate HF-HClO 4 sample decompositions <strong>and</strong> ICPMS analyses in 0.5 M HCl. Grey bars represent<br />
variability in the calculated ratio that is due solely to uncertainty in the reference average. Vertical lines<br />
represent the variability in the calculated ratio due to the uncertainty <strong>of</strong> the JUB data, <strong>and</strong> all data are<br />
presented in App. 1. Data for Sc not reported due to high IQL, <strong>and</strong> Nb not reported due to significant<br />
FeCl interference. Reasons for poor observed Ti accuracy are considered to be similar to those proposed<br />
for FeR-4 (see text for details). Lower JUB concentrations for Hf, Ta, Pb, <strong>and</strong> Th are not considered<br />
anomalous, as it is likely that these elements are present at concentrations lower than originally reported<br />
for IF-G, an observation supported by the data <strong>of</strong> Dulski et al. (2001) <strong>and</strong> Bohlar et al. (2004).<br />
performed using the current 32 element ICPMS analysis (see App. 1). Results from<br />
these analyses are presented in Figure 15, <strong>and</strong> JUB data for 23 <strong>of</strong> 32 elements are<br />
between 90–100% <strong>of</strong> the average reference values. Data for Sc <strong>and</strong> Nb are not shown,<br />
as Sc concentrations in IF-G (~0.3 mg/kg) are below the IQL for Sc (Fig. 4), <strong>and</strong><br />
literature Nb concentrations <strong>of</strong> ~0.1 mg/kg are significantly lower than the predicted<br />
FeCl interferences on 93 Nb <strong>of</strong> ~0.6 mg/kg (Apps. 1 <strong>and</strong> 2).<br />
The apparent poor accuracy <strong>of</strong> the JUB determination for Ti is considered to<br />
arise from reasons similar to those proposed for Ti determinations in FeR-4, i.e., a<br />
combination <strong>of</strong> low concentration (84 mg/kg) <strong>and</strong> analytical methodology for<br />
determination <strong>of</strong> the reference values (e.g., sample fusion <strong>and</strong> XRF analyses). The<br />
wide discrepancy observed for the Hf, Ta, Pb, <strong>and</strong> Th data <strong>of</strong> this study is primarily<br />
due to the inclusion <strong>of</strong> values from Govindaraju (1994) when calculating the<br />
reference average for these elements. Compared to more recent ICPMS analyses by<br />
Dulski (2001) <strong>and</strong> Bohlar et al. (2004), JUB data for these elements are quite<br />
38


