

School of Engineering and Science - Jacobs University
School of Engineering and Science - Jacobs University
School of Engineering and Science - Jacobs University

You also want an ePaper? Increase the reach of your titles
YUMPU automatically turns print PDFs into web optimized ePapers that Google loves.
100<br />
10<br />
MORB<br />
1<br />
0.1<br />
raw data (mg/kg)<br />
chondrite-normalized<br />
La Ce Pr Nd<br />
Sm Eu Gd Tb Dy Y Ho Er Tm Yb Lu<br />
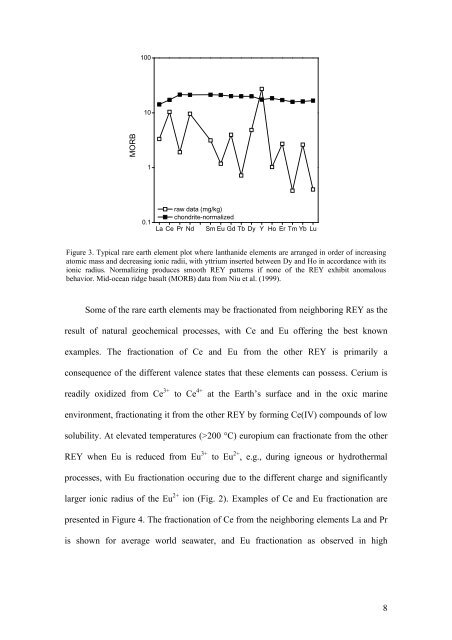
Figure 3. Typical rare earth element plot where lanthanide elements are arranged in order <strong>of</strong> increasing<br />
atomic mass <strong>and</strong> decreasing ionic radii, with yttrium inserted between Dy <strong>and</strong> Ho in accordance with its<br />
ionic radius. Normalizing produces smooth REY patterns if none <strong>of</strong> the REY exhibit anomalous<br />
behavior. Mid-ocean ridge basalt (MORB) data from Niu et al. (1999).<br />
Some <strong>of</strong> the rare earth elements may be fractionated from neighboring REY as the<br />
result <strong>of</strong> natural geochemical processes, with Ce <strong>and</strong> Eu <strong>of</strong>fering the best known<br />
examples. The fractionation <strong>of</strong> Ce <strong>and</strong> Eu from the other REY is primarily a<br />
consequence <strong>of</strong> the different valence states that these elements can possess. Cerium is<br />
readily oxidized from Ce 3+ to Ce 4+ at the Earth’s surface <strong>and</strong> in the oxic marine<br />
environment, fractionating it from the other REY by forming Ce(IV) compounds <strong>of</strong> low<br />
solubility. At elevated temperatures (>200 °C) europium can fractionate from the other<br />
REY when Eu is reduced from Eu 3+ to Eu 2+ , e.g., during igneous or hydrothermal<br />
processes, with Eu fractionation occuring due to the different charge <strong>and</strong> significantly<br />
larger ionic radius <strong>of</strong> the Eu 2+ ion (Fig. 2). Examples <strong>of</strong> Ce <strong>and</strong> Eu fractionation are<br />
presented in Figure 4. The fractionation <strong>of</strong> Ce from the neighboring elements La <strong>and</strong> Pr<br />
is shown for average world seawater, <strong>and</strong> Eu fractionation as observed in high<br />
8


