

School of Engineering and Science - Jacobs University
School of Engineering and Science - Jacobs University
School of Engineering and Science - Jacobs University

You also want an ePaper? Increase the reach of your titles
YUMPU automatically turns print PDFs into web optimized ePapers that Google loves.
Author's personal copy<br />
B.W. Alex<strong>and</strong>er et al. / Earth <strong>and</strong> Planetary <strong>Science</strong> Letters 283 (2009) 144–155<br />
149<br />
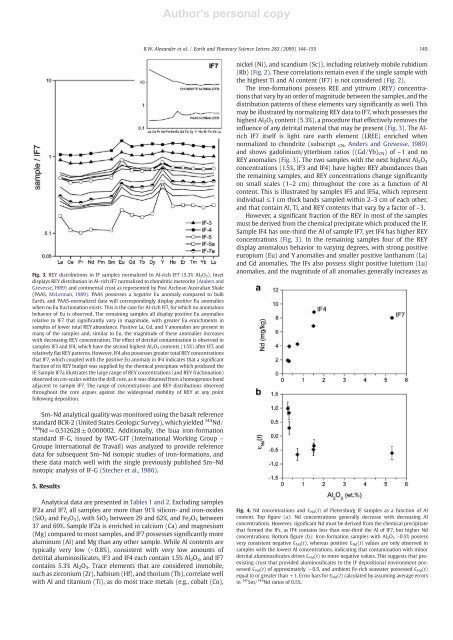
Fig. 3. REY distributions in IF samples normalized to Al-rich IF7 (5.3% Al 2 O 3 ). Inset<br />
displays REY distribution in Al-rich IF7 normalized to chondritic meteorite (Anders <strong>and</strong><br />
Grevesse, 1989) <strong>and</strong> continental crust as represented by Post Archean Australian Shale<br />
(PAAS, McLennan, 1989). PAAS possesses a negative Eu anomaly compared to bulk<br />
Earth, <strong>and</strong> PAAS-normalized data will correspondingly display positive Eu anomalies<br />
when no Eu fractionation exists. This is the case for Al-rich IF7, for which no anomalous<br />
behavior <strong>of</strong> Eu is observed. The remaining samples all display positive Eu anomalies<br />
relative to IF7 that significantly vary in magnitude, with greater Eu enrichments in<br />
samples <strong>of</strong> lower total REY abundance. Positive La, Gd, <strong>and</strong> Y anomalies are present in<br />
many <strong>of</strong> the samples <strong>and</strong>, similar to Eu, the magnitude <strong>of</strong> these anomalies increases<br />
with decreasing REY concentration. The effect <strong>of</strong> detrital contamination is observed in<br />
samples IF3 <strong>and</strong> IF4, which have the second highest Al 2 O 3 contents (1.5%) after IF7, <strong>and</strong><br />
relatively flat REY patterns. However, IF4 also possesses greater total REY concentrations<br />
that IF7, which coupled with the positive Eu anomaly in IF4 indicates that a significant<br />
fraction <strong>of</strong> its REY budget was supplied by the chemical precipitate which produced the<br />
IF. Sample IF7a illustrates the large range <strong>of</strong> REY concentrations (<strong>and</strong> REY fractionation)<br />
observed on cm-scales within the drill core, as it was obtained from a homogenous b<strong>and</strong><br />
adjacent to sample IF7. The range <strong>of</strong> concentrations <strong>and</strong> REY distributions observed<br />
throughout the core argues against the widespread mobility <strong>of</strong> REY at any point<br />
following deposition.<br />
nickel (Ni), <strong>and</strong> sc<strong>and</strong>ium (Sc)), including relatively mobile rubidium<br />
(Rb) (Fig. 2). These correlations remain even if the single sample with<br />
the highest Ti <strong>and</strong> Al content (IF7) is not considered (Fig. 2).<br />
The iron-formations possess REE <strong>and</strong> yttrium (REY) concentrations<br />
that vary by an order <strong>of</strong> magnitude between the samples, <strong>and</strong> the<br />
distribution patterns <strong>of</strong> these elements vary significantly as well. This<br />
may be illustrated by normalizing REY data to IF7, which possesses the<br />
highest Al 2 O 3 content (5.3%), a procedure that effectively removes the<br />
influence <strong>of</strong> any detrital material that may be present (Fig. 3). The Alrich<br />
IF7 itself is light rare earth element (LREE) enriched when<br />
normalized to chondrite (subscript CN , Anders <strong>and</strong> Grevesse, 1989)<br />
<strong>and</strong> shows gadolinium/ytterbium ratios ((Gd/Yb) CN ) <strong>of</strong> ~1 <strong>and</strong> no<br />
REY anomalies (Fig. 3). The two samples with the next highest Al 2 O 3<br />
concentrations (1.5%, IF3 <strong>and</strong> IF4) have higher REY abundances than<br />
the remaining samples, <strong>and</strong> REY concentrations change significantly<br />
on small scales (1–2 cm) throughout the core as a function <strong>of</strong> Al<br />
content. This is illustrated by samples IF5 <strong>and</strong> IF5a, which represent<br />
individual ≤1 cm thick b<strong>and</strong>s sampled within 2–3 cm <strong>of</strong> each other,<br />
<strong>and</strong> that contain Al, Ti, <strong>and</strong> REY contents that vary by a factor <strong>of</strong> ~3.<br />
However, a significant fraction <strong>of</strong> the REY in most <strong>of</strong> the samples<br />
must be derived from the chemical precipitate which produced the IF.<br />
Sample IF4 has one-third the Al <strong>of</strong> sample IF7, yet IF4 has higher REY<br />
concentrations (Fig. 3). In the remaining samples four <strong>of</strong> the REY<br />
display anomalous behavior to varying degrees, with strong positive<br />
europium (Eu) <strong>and</strong> Y anomalies <strong>and</strong> smaller positive lanthanum (La)<br />
<strong>and</strong> Gd anomalies. The IFs also possess slight positive lutetium (Lu)<br />
anomalies, <strong>and</strong> the magnitude <strong>of</strong> all anomalies generally increases as<br />
Sm–Nd analytical quality was monitored using the basalt reference<br />
st<strong>and</strong>ard BCR-2 (United States Geologic Survey), which yielded 143 Nd/<br />
144 Nd=0.512628±0.000002. Additionally, the Isua iron-formation<br />
st<strong>and</strong>ard IF-G, issued by IWG-GIT (International Working Group –<br />
Groupe International de Travail) was analyzed to provide reference<br />
data for subsequent Sm–Nd isotopic studies <strong>of</strong> iron-formations, <strong>and</strong><br />
these data match well with the single previously published Sm–Nd<br />
isotopic analysis <strong>of</strong> IF-G (Stecher et al., 1986).<br />
5. Results<br />
Analytical data are presented in Tables 1 <strong>and</strong> 2. Excluding samples<br />
IF2a <strong>and</strong> IF7, all samples are more than 91% silicon- <strong>and</strong> iron-oxides<br />
(SiO 2 <strong>and</strong> Fe 2 O 3 ), with SiO 2 between 29 <strong>and</strong> 62%, <strong>and</strong> Fe 2 O 3 between<br />
37 <strong>and</strong> 69%. Sample IF2a is enriched in calcium (Ca) <strong>and</strong> magnesium<br />
(Mg) compared to most samples, <strong>and</strong> IF7 possesses significantly more<br />
aluminum (Al) <strong>and</strong> Mg than any other sample. While Al contents are<br />
typically very low (b0.8%), consistent with very low amounts <strong>of</strong><br />
detrital aluminosilicates, IF3 <strong>and</strong> IF4 each contain 1.5% Al 2 O 3 , <strong>and</strong> IF7<br />
contains 5.3% Al 2 O 3 . Trace elements that are considered immobile,<br />
such as zirconium (Zr), hafnium (Hf), <strong>and</strong> thorium (Th), correlate well<br />
with Al <strong>and</strong> titanium (Ti), as do most trace metals (e.g., cobalt (Co),<br />
Fig. 4. Nd concentrations <strong>and</strong> Є Nd (t) <strong>of</strong> Pietersburg IF samples as a function <strong>of</strong> Al<br />
content. Top figure (a): Nd concentrations generally decrease with decreasing Al<br />
concentrations. However, significant Nd must be derived from the chemical precipitate<br />
that formed the IFs, as IF4 contains less than one-third the Al <strong>of</strong> IF7, but higher Nd<br />
concentrations. Bottom figure (b): Iron-formation samples with Al 2 O 3 N0.5% possess<br />
very consistent negative Є Nd (t), whereas positive Є Nd (t) values are only observed in<br />
samples with the lowest Al concentrations, indicating that contamination with minor<br />
detrital aluminosilicates drives Є Nd (t) to more negative values. This suggests that preexisting<br />
crust that provided aluminosilicates to the IF depositional environment possessed<br />
Є Nd (t) <strong>of</strong> approximately −0.5, <strong>and</strong> ambient Fe-rich seawater possessed Є Nd (t)<br />
equal to or greater than +1. Error bars for Є Nd (t) calculated by assuming average errors<br />
in 147 Sm/ 144 Nd ratios <strong>of</strong> 0.5%.


