

School of Engineering and Science - Jacobs University
School of Engineering and Science - Jacobs University
School of Engineering and Science - Jacobs University

Create successful ePaper yourself
Turn your PDF publications into a flip-book with our unique Google optimized e-Paper software.
10 -2 hydrothermal fluid<br />
10 -3<br />
10 -4<br />
sample/PAAS<br />
10 -5<br />
10 -6<br />
10 -7<br />
10 -8<br />
10 -9<br />
river water<br />
marine pore water<br />
estuaries<br />
world seawater<br />
La Ce Pr Nd PmSm Eu Gd Tb Dy Y Ho Er Tm Yb Lu<br />
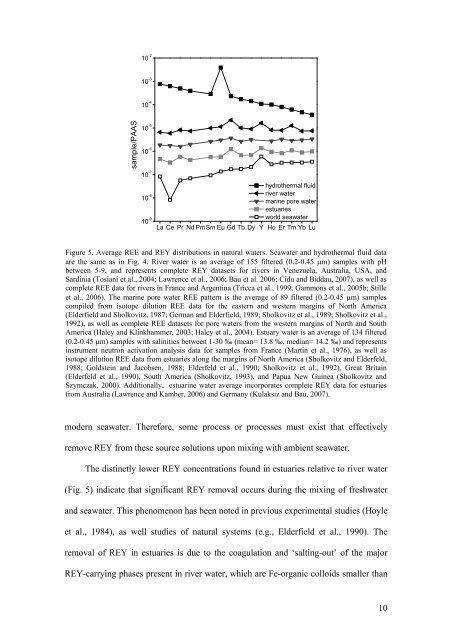
Figure 5. Average REE <strong>and</strong> REY distributions in natural waters. Seawater <strong>and</strong> hydrothermal fluid data<br />
are the same as in Fig. 4. River water is an average <strong>of</strong> 155 filtered (0.2-0.45 μm) samples with pH<br />
between 5-9, <strong>and</strong> represents complete REY datasets for rivers in Venezuela, Australia, USA, <strong>and</strong><br />
Sardinia (Tosiani et al., 2004; Lawrence et al., 2006; Bau et al. 2006; Cidu <strong>and</strong> Biddau, 2007), as well as<br />
complete REE data for rivers in France <strong>and</strong> Argentina (Tricca et al., 1999; Gammons et al., 2005b; Stille<br />
et al., 2006). The marine pore water REE pattern is the average <strong>of</strong> 89 filtered (0.2-0.45 μm) samples<br />
compiled from isotope dilution REE data for the eastern <strong>and</strong> western margins <strong>of</strong> North America<br />
(Elderfield <strong>and</strong> Sholkovitz, 1987; German <strong>and</strong> Elderfield, 1989; Sholkovitz et al., 1989; Sholkovitz et al.,<br />
1992), as well as complete REE datasets for pore waters from the western margins <strong>of</strong> North <strong>and</strong> South<br />
America (Haley <strong>and</strong> Klinkhammer, 2003; Haley et al., 2004). Estuary water is an average <strong>of</strong> 134 filtered<br />
(0.2-0.45 μm) samples with salinities between 1-30 ‰ (mean= 13.8 ‰, median= 14.2 ‰) <strong>and</strong> represents<br />
instrument neutron activation analysis data for samples from France (Martin et al., 1976), as well as<br />
isotope dilution REE data from estuaries along the margins <strong>of</strong> North America (Sholkovitz <strong>and</strong> Elderfeld,<br />
1988; Goldstein <strong>and</strong> <strong>Jacobs</strong>en, 1988; Elderfeld et al., 1990; Sholkovitz et al., 1992), Great Britain<br />
(Elderfeld et al., 1990), South America (Sholkovitz, 1993), <strong>and</strong> Papua New Guinea (Sholkovitz <strong>and</strong><br />
Szymczak, 2000). Additionally, estuarine water average incorporates complete REY data for estuaries<br />
from Australia (Lawrence <strong>and</strong> Kamber, 2006) <strong>and</strong> Germany (Kulaksız <strong>and</strong> Bau, 2007).<br />
modern seawater. Therefore, some process or processes must exist that effectively<br />
remove REY from these source solutions upon mixing with ambient seawater.<br />
The distinctly lower REY concentrations found in estuaries relative to river water<br />
(Fig. 5) indicate that significant REY removal occurs during the mixing <strong>of</strong> freshwater<br />
<strong>and</strong> seawater. This phenomenon has been noted in previous experimental studies (Hoyle<br />
et al., 1984), as well studies <strong>of</strong> natural systems (e.g., Elderfield et al., 1990). The<br />
removal <strong>of</strong> REY in estuaries is due to the coagulation <strong>and</strong> ‘salting-out’ <strong>of</strong> the major<br />
REY-carrying phases present in river water, which are Fe-organic colloids smaller than<br />
10


