

School of Engineering and Science - Jacobs University
School of Engineering and Science - Jacobs University
School of Engineering and Science - Jacobs University

You also want an ePaper? Increase the reach of your titles
YUMPU automatically turns print PDFs into web optimized ePapers that Google loves.
1.50 FeR-2 (n=3)<br />
1.25<br />
JUB / reference average<br />
1.00<br />
0.75<br />
0.50<br />
0.25<br />
0.00<br />
Sc Ti Co Ni Rb Sr Y Zr Nb Mo Cs Ba La Ce Pr Nd Sm Eu Gd Tb Dy Ho Er Tm Yb Lu Hf Ta W Pb Th U<br />
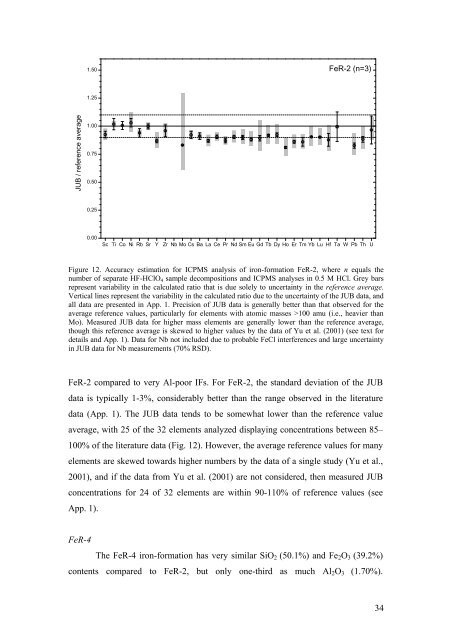
Figure 12. Accuracy estimation for ICPMS analysis <strong>of</strong> iron-formation FeR-2, where n equals the<br />
number <strong>of</strong> separate HF-HClO 4 sample decompositions <strong>and</strong> ICPMS analyses in 0.5 M HCl. Grey bars<br />
represent variability in the calculated ratio that is due solely to uncertainty in the reference average.<br />
Vertical lines represent the variability in the calculated ratio due to the uncertainty <strong>of</strong> the JUB data, <strong>and</strong><br />
all data are presented in App. 1. Precision <strong>of</strong> JUB data is generally better than that observed for the<br />
average reference values, particularly for elements with atomic masses >100 amu (i.e., heavier than<br />
Mo). Measured JUB data for higher mass elements are generally lower than the reference average,<br />
though this reference average is skewed to higher values by the data <strong>of</strong> Yu et al. (2001) (see text for<br />
details <strong>and</strong> App. 1). Data for Nb not included due to probable FeCl interferences <strong>and</strong> large uncertainty<br />
in JUB data for Nb measurements (70% RSD).<br />
FeR-2 compared to very Al-poor IFs. For FeR-2, the st<strong>and</strong>ard deviation <strong>of</strong> the JUB<br />
data is typically 1-3%, considerably better than the range observed in the literature<br />
data (App. 1). The JUB data tends to be somewhat lower than the reference value<br />
average, with 25 <strong>of</strong> the 32 elements analyzed displaying concentrations between 85–<br />
100% <strong>of</strong> the literature data (Fig. 12). However, the average reference values for many<br />
elements are skewed towards higher numbers by the data <strong>of</strong> a single study (Yu et al.,<br />
2001), <strong>and</strong> if the data from Yu et al. (2001) are not considered, then measured JUB<br />
concentrations for 24 <strong>of</strong> 32 elements are within 90-110% <strong>of</strong> reference values (see<br />
App. 1).<br />
FeR-4<br />
The FeR-4 iron-formation has very similar SiO 2 (50.1%) <strong>and</strong> Fe 2 O 3 (39.2%)<br />
contents compared to FeR-2, but only one-third as much Al 2 O 3 (1.70%).<br />
34


