Section One
Section One
Section One

Create successful ePaper yourself
Turn your PDF publications into a flip-book with our unique Google optimized e-Paper software.
138<br />
Figure 4.1<br />
Table 4.6<br />
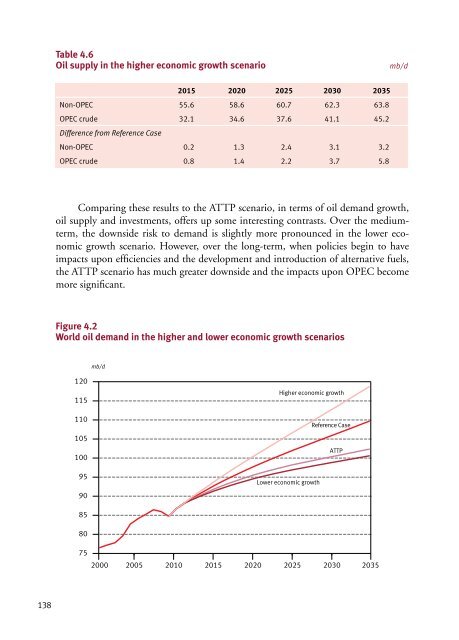
Oil supply in the higher economic growth scenario mb/d<br />
mb/d<br />
2015 2020 2025 2030 2035<br />
Non-OPEC 110<br />
55.6 58.6 60.7 62.3 63.8<br />
OPEC crude<br />
105<br />
Difference from Reference Case<br />
32.1 34.6 37.6 Reference Case 41.1 45.2<br />
Non-OPEC 100<br />
0.2 1.3 2.4 3.1 3.2<br />
OPEC crude<br />
95<br />
0.8 1.4 2.2 ATTP 3.7 5.8<br />
90<br />
Comparing these results to the ATTP scenario, in terms of oil demand growth,<br />
oil supply 85 and investments, offers up some interesting contrasts. Over the mediumterm,<br />
the downside risk to demand is slightly more pronounced in the lower eco-<br />
nomic 80growth<br />
scenario. However, over the long-term, when policies begin to have<br />
impacts upon efficiencies and the development and introduction of alternative fuels,<br />
the ATTP 75 scenario has much greater downside and the impacts upon OPEC become<br />
more significant.<br />
2000 2005 2010 2015 2020 2025 2030 2035<br />
Figure 4.2<br />
World oil demand in the higher and lower economic Figure 4.3 growth scenarios<br />
120<br />
115<br />
110<br />
105<br />
100<br />
95<br />
90<br />
85<br />
80<br />
mb/d<br />
Higher economic growth<br />
Lower economic growth<br />
Reference Case<br />
75<br />
2000 2005 2010 2015 2020 2025 2030 2035<br />
ATTP<br />
Figure 4.5<br />
mb/d<br />
80<br />
70<br />
60<br />
50<br />
40<br />
30<br />
20<br />
10<br />
46<br />
44<br />
42<br />
40<br />
38<br />
36<br />
34<br />
32<br />
30<br />
28<br />
26<br />
24<br />
0<br />
mb/d<br />
200