Section One
Section One
Section One

Create successful ePaper yourself
Turn your PDF publications into a flip-book with our unique Google optimized e-Paper software.
n (millions)<br />
7,000<br />
0<br />
China Brazil Russia India Mexico Japan Indonesia Poland Iran Argentina<br />
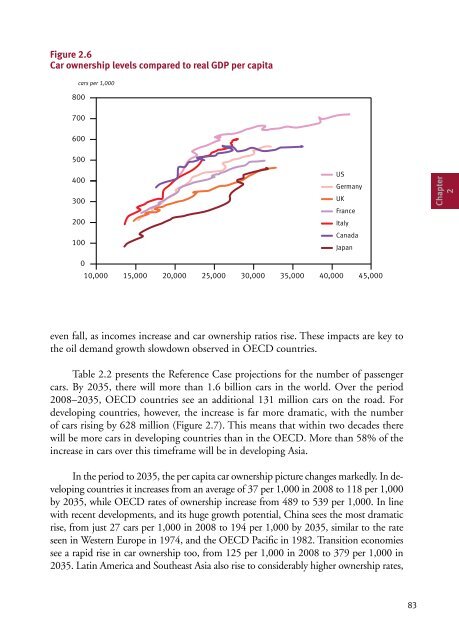
Figure 2.6<br />
Car ownership levels compared to real GDP per capita<br />
cars per 1,000<br />
800<br />
700<br />
600<br />
500<br />
400<br />
300<br />
200<br />
100<br />
Figure 2.6 test 2<br />
US<br />
Germany<br />
UK<br />
France<br />
Italy<br />
Canada<br />
Japan<br />
0<br />
10,000 15,000 20,000 25,000 30,000 35,000 40,000 45,000<br />
700<br />
300<br />
Figure 2.7<br />
Figure 2.8<br />
GDP per capita ($(2005))<br />
even fall, as millions incomes increase and car ownership ratios rise. These impacts are key to<br />
the oil demand growth slowdown observed in OECD countries.<br />
Table 2.2 presents the Reference Case projections for the number of passenger<br />
600 cars. By 2035, there will more than 1.6 billion cars in the world. Over the period<br />
Other developing<br />
2008–2035, OECD countries see an additional 131 million countries cars on the road. For<br />
developing 500 countries, however, the increase is far more dramatic, with the number<br />
of cars rising by 628 million (Figure 2.7). This means that within two decades there<br />
will be 400 more cars in developing countries than in the OECD. More than 58% of the<br />
increase in cars over this timeframe will be in developing Asia.<br />
In the period to 2035, the per capita car ownership picture changes markedly. In de-<br />
Asian developing<br />
countries<br />
veloping 200 countries it increases from an average of 37 per 1,000 in 2008 to 118 per 1,000<br />
by 2035, while OECD rates of ownership increase from 489 to 539 per 1,000. In line<br />
with recent 100 developments, OECD and transition its huge growth potential, China sees the most dramatic<br />
economy countries<br />
rise, from just 27 cars per 1,000 in 2008 to 194 per 1,000 by 2035, similar to the rate<br />
seen in Western 0 Europe in 1974, and the OECD Pacific in 1982. Transition economies<br />
see a rapid rise in car ownership too, from 125 per 1,000 in 2008 to 379 per 1,000 in<br />
2035. Latin America and Southeast Asia also rise to considerably higher ownership rates,<br />
83<br />
Chapter<br />
2