Section One
Section One
Section One

You also want an ePaper? Increase the reach of your titles
YUMPU automatically turns print PDFs into web optimized ePapers that Google loves.
98<br />
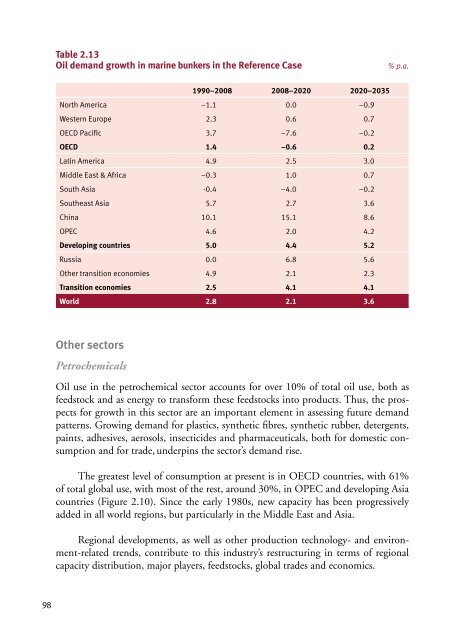
Table 2.13<br />
Oil demand growth in marine bunkers in the Reference Case % p.a.<br />
1990–2008 2008–2020 2020–2035<br />
North America –1.1 0.0 –0.9<br />
Western Europe 2.3 0.6 0.7<br />
OECD Pacific 3.7 –7.6 –0.2<br />
OECD 1.4 –0.6 0.2<br />
Latin America 4.9 2.5 3.0<br />
Middle East & Africa –0.3 1.0 0.7<br />
South Asia -0.4 –4.0 –0.2<br />
Southeast Asia 5.7 2.7 3.6<br />
China 10.1 15.1 8.6<br />
OPEC 4.6 2.0 4.2<br />
Developing countries 5.0 4.4 5.2<br />
Russia 0.0 6.8 5.6<br />
Other transition economies 4.9 2.1 2.3<br />
Transition economies 2.5 4.1 4.1<br />
World 2.8 2.1 3.6<br />
Other sectors<br />
Petrochemicals<br />
Oil use in the petrochemical sector accounts for over 10% of total oil use, both as<br />
feedstock and as energy to transform these feedstocks into products. Thus, the prospects<br />
for growth in this sector are an important element in assessing future demand<br />
patterns. Growing demand for plastics, synthetic fibres, synthetic rubber, detergents,<br />
paints, adhesives, aerosols, insecticides and pharmaceuticals, both for domestic consumption<br />
and for trade, underpins the sector’s demand rise.<br />
The greatest level of consumption at present is in OECD countries, with 61%<br />
of total global use, with most of the rest, around 30%, in OPEC and developing Asia<br />
countries (Figure 2.10). Since the early 1980s, new capacity has been progressively<br />
added in all world regions, but particularly in the Middle East and Asia.<br />
Regional developments, as well as other production technology- and environment-related<br />
trends, contribute to this industry’s restructuring in terms of regional<br />
capacity distribution, major players, feedstocks, global trades and economics.