Section One
Section One
Section One

You also want an ePaper? Increase the reach of your titles
YUMPU automatically turns print PDFs into web optimized ePapers that Google loves.
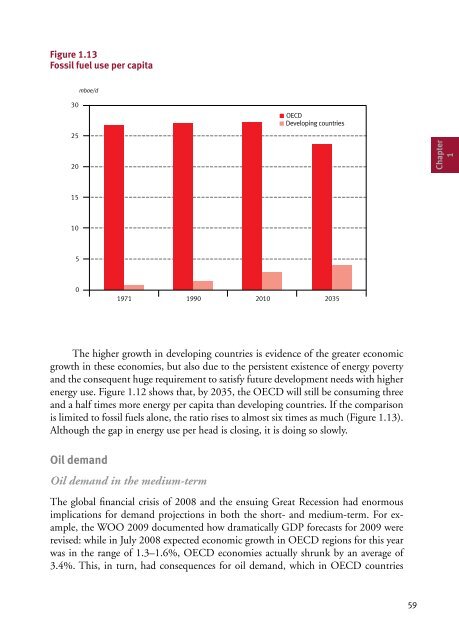
Figure 1.13<br />
Fossil fuel use per capita<br />
30<br />
25<br />
20<br />
15<br />
10<br />
5<br />
0<br />
mboe/d<br />
Figure 1.13<br />
OECD<br />
Developing countries<br />
1971 1990 2010 2035<br />
The higher growth in developing Figure countries 1.14 is evidence of the greater economic<br />
growth in these economies, but also due to the persistent existence of energy poverty<br />
and the consequent huge requirement to satisfy future development needs with higher<br />
energy use. mb/d Figure 1.12 shows that, by 2035, the OECD will still be consuming three<br />
and a 97 half times more energy per capita than developing countries. If the comparison<br />
is limited to fossil fuels alone, the ratio rises to almost six times as much (Figure 1.13).<br />
96<br />
Although the gap in energy use per head is closing, it is doing so slowly.<br />
95<br />
Oil demand<br />
94<br />
93<br />
Oil demand in the medium-term<br />
92<br />
The global financial crisis of 2008 and the ensuing Great Recession had enormous<br />
implications 91 for demand projections in both the short- and medium-term. For ex-<br />
ample, the WOO 2009 documented how dramatically GDP forecasts for 2009 were<br />
90<br />
revised: while in July 2008 expected economic growth in OECD regions for this year<br />
was in 89 the range of 1.3–1.6%, OECD economies actually shrunk by an average of<br />
3.4%. This, in turn, had consequences for oil demand, which in OECD countries<br />
88<br />
87<br />
2007 2008 2009 2010 2011<br />
Year of WOO<br />
59<br />
Chapter<br />
1