Section One
Section One
Section One

You also want an ePaper? Increase the reach of your titles
YUMPU automatically turns print PDFs into web optimized ePapers that Google loves.
78<br />
0<br />
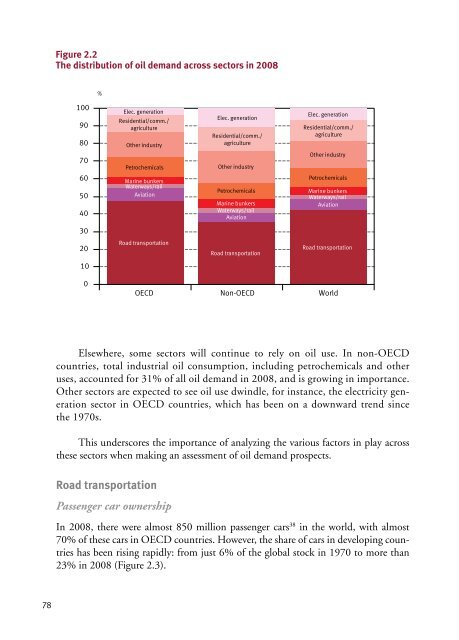
Figure 2.2<br />
The distribution of oil demand across sectors in 2008<br />
Figure 2.2<br />
100<br />
90<br />
80<br />
70<br />
60<br />
50<br />
40<br />
30<br />
20<br />
10<br />
0<br />
%<br />
Elec. generation<br />
Residential/comm./<br />
agriculture<br />
Other industry<br />
Petrochemicals<br />
Marine bunkers<br />
Waterways/rail<br />
Aviation<br />
Road transportation<br />
900 Elsewhere, some sectors will continue to rely on oil use. In non-OECD<br />
countries, total industrial oil consumption, including petrochemicals and other<br />
800<br />
OECD<br />
uses, accounted for Developing 31% of countries all oil demand in 2008, and is growing in importance.<br />
Transition economies<br />
Other 700sectors<br />
are expected to see oil use dwindle, for instance, the electricity generation<br />
sector in OECD countries, which has been on a downward trend since<br />
600<br />
the 1970s.<br />
500<br />
This underscores the importance of analyzing the various factors in play across<br />
400<br />
these sectors when making an assessment of oil demand prospects.<br />
300<br />
millions<br />
Road 200 transportation<br />
Passenger 100 car ownership<br />
OECD Non-OECD<br />
Elec. generation<br />
Residential/comm./<br />
agriculture<br />
Other industry<br />
Petrochemicals<br />
Marine bunkers<br />
Waterways/rail<br />
Aviation<br />
Road transportation<br />
Figure 2.3<br />
In 2008, there were almost 850 million passenger cars38 0<br />
in the world, with almost<br />
70% of these 1970 cars 1974 in OECD 1978 countries. 1982 1986 However, 1990 the 1994 share 1998 of cars 2002 in developing 2006 countries<br />
has been rising rapidly: from just 6% of the global stock in 1970 to more than<br />
23% in 2008 (Figure 2.3).<br />
cars per 1,000<br />
Figure 2.4<br />
Elec. generation<br />
Residential/comm./<br />
agriculture<br />
Other industry<br />
Petrochemicals<br />
Marine bunkers<br />
Waterways/rail<br />
Aviation<br />
Road transportation<br />
OECD Non-OECD World<br />
population (millions)<br />
7,000<br />
cars<br />
800<br />
700<br />
600<br />
500<br />
400<br />
300<br />
200<br />
100<br />
0<br />
10<br />
700<br />
600<br />
500<br />
400<br />
300<br />
200<br />
100<br />
0