Section One
Section One
Section One

Create successful ePaper yourself
Turn your PDF publications into a flip-book with our unique Google optimized e-Paper software.
120<br />
limiting factor for feasible supply paths. This analysis becomes increasingly important<br />
the further the projection extends into the future.<br />
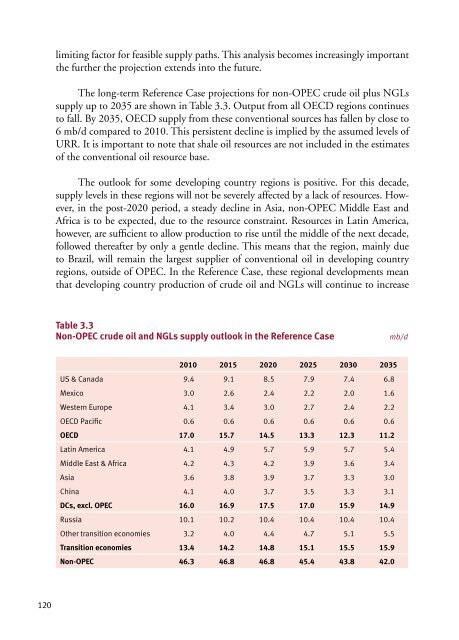
The long-term Reference Case projections for non-OPEC crude oil plus NGLs<br />
supply up to 2035 are shown in Table 3.3. Output from all OECD regions continues<br />
to fall. By 2035, OECD supply from these conventional sources has fallen by close to<br />
6 mb/d compared to 2010. This persistent decline is implied by the assumed levels of<br />
URR. It is important to note that shale oil resources are not included in the estimates<br />
of the conventional oil resource base.<br />
The outlook for some developing country regions is positive. For this decade,<br />
supply levels in these regions will not be severely affected by a lack of resources. However,<br />
in the post-2020 period, a steady decline in Asia, non-OPEC Middle East and<br />
Africa is to be expected, due to the resource constraint. Resources in Latin America,<br />
however, are sufficient to allow production to rise until the middle of the next decade,<br />
followed thereafter by only a gentle decline. This means that the region, mainly due<br />
to Brazil, will remain the largest supplier of conventional oil in developing country<br />
regions, outside of OPEC. In the Reference Case, these regional developments mean<br />
that developing country production of crude oil and NGLs will continue to increase<br />
Table 3.3<br />
Non-OPEC crude oil and NGLs supply outlook in the Reference Case mb/d<br />
2010 2015 2020 2025 2030 2035<br />
US & Canada 9.4 9.1 8.5 7.9 7.4 6.8<br />
Mexico 3.0 2.6 2.4 2.2 2.0 1.6<br />
Western Europe 4.1 3.4 3.0 2.7 2.4 2.2<br />
OECD Pacific 0.6 0.6 0.6 0.6 0.6 0.6<br />
OECD 17.0 15.7 14.5 13.3 12.3 11.2<br />
Latin America 4.1 4.9 5.7 5.9 5.7 5.4<br />
Middle East & Africa 4.2 4.3 4.2 3.9 3.6 3.4<br />
Asia 3.6 3.8 3.9 3.7 3.3 3.0<br />
China 4.1 4.0 3.7 3.5 3.3 3.1<br />
DCs, excl. OPEC 16.0 16.9 17.5 17.0 15.9 14.9<br />
Russia 10.1 10.2 10.4 10.4 10.4 10.4<br />
Other transition economies 3.2 4.0 4.4 4.7 5.1 5.5<br />
Transition economies 13.4 14.2 14.8 15.1 15.5 15.9<br />
Non-OPEC 46.3 46.8 46.8 45.4 43.8 42.0