Section One
Section One
Section One

Create successful ePaper yourself
Turn your PDF publications into a flip-book with our unique Google optimized e-Paper software.
50<br />
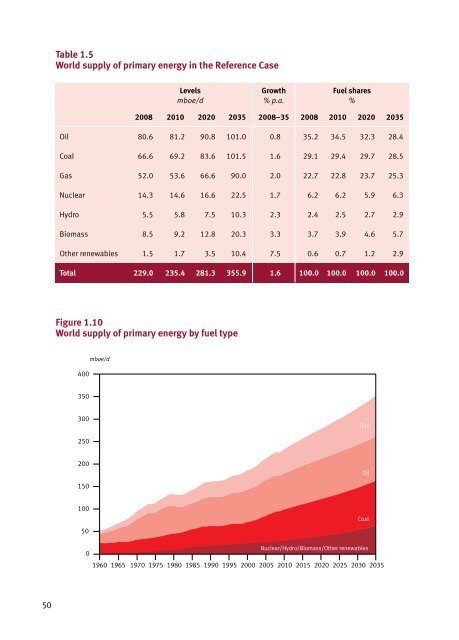
Table 1.5<br />
World supply of primary energy in the Reference Case<br />
Levels<br />
mboe/d<br />
Growth<br />
% p.a.<br />
Fuel shares<br />
%<br />
2008 2010 2020 2035 2008–35 2008 2010 2020 2035<br />
Oil 80.6 81.2 90.8 101.0 0.8 35.2 34.5 32.3 28.4<br />
Coal 66.6 69.2 83.6 101.5 1.6 29.1 29.4 29.7 28.5<br />
Gas 52.0 53.6 66.6 90.0 2.0 22.7 22.8 23.7 25.3<br />
Nuclear 14.3 14.6 16.6 22.5 1.7 6.2 6.2 5.9 6.3<br />
Hydro 5.5 5.8 7.5 10.3 2.3 2.4 2.5 2.7 2.9<br />
Biomass 8.5 9.2 12.8 20.3 3.3 3.7 3.9 4.6 5.7<br />
Other renewables 1.5 1.7 3.5 10.4 7.5 0.6 0.7 1.2 2.9<br />
Total 229.0 235.4 281.3 355.9 1.6 100.0 100.0 100.0 100.0<br />
Figure 1.10<br />
Figure 1.10<br />
World supply of primary energy by fuel type<br />
400<br />
350<br />
300<br />
250<br />
200<br />
150<br />
100<br />
50<br />
mboe/d<br />
Nuclear/Hydro/Biomass/Other renewables<br />
0<br />
1960 1965 1970 1975 1980 1985 1990 1995 2000 2005 2010 2015 2020 2025 2030 2035<br />
45<br />
mboe/d<br />
Figure 1.11<br />
Gas<br />
Oil<br />
Coal