Section One
Section One
Section One

You also want an ePaper? Increase the reach of your titles
YUMPU automatically turns print PDFs into web optimized ePapers that Google loves.
onboard equipment, and better navigation and traffic control. Although some of these<br />
gains will be difficult to improve on in the future, the International Air Transport<br />
Association (IATA) 42 has adopted a voluntary target to reduce fuel consumption and<br />
CO 2 emissions by at least 25% by 2020 – per revenue tonne kilometre – compared<br />
to 2005 levels. 43<br />
In developed countries, the market is approaching saturation, particularly in<br />
the US. Indeed, the lowest percentage increase in aviation passenger traffic over the<br />
past three decades has been in North America. Looking forward, it is clear that there<br />
is huge potential for air traffic growth in developing countries. This is borne out by<br />
the dramatic differences in aviation traffic growth observed across regions. While the<br />
world average for aviation travel was about one flight per person in 2007, it ranged<br />
from 0.006 flights per head in Bangladesh, to over 13 flights per head in Ireland. 44<br />
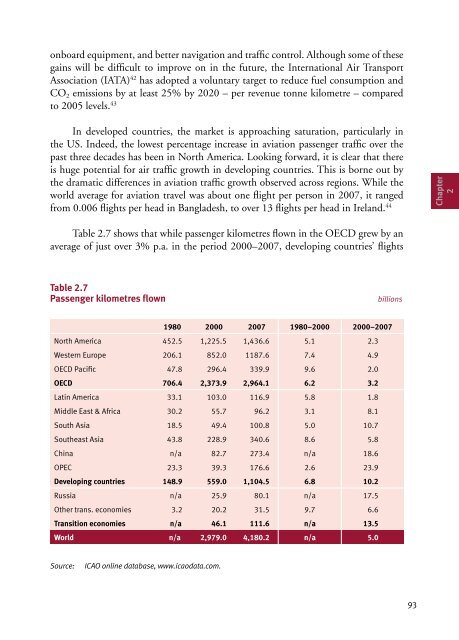
Table 2.7 shows that while passenger kilometres flown in the OECD grew by an<br />
average of just over 3% p.a. in the period 2000–2007, developing countries’ flights<br />
Table 2.7<br />
Passenger kilometres flown billions<br />
1980 2000 2007 1980–2000 2000–2007<br />
North America 452.5 1,225.5 1,436.6 5.1 2.3<br />
Western Europe 206.1 852.0 1187.6 7.4 4.9<br />
OECD Pacific 47.8 296.4 339.9 9.6 2.0<br />
OECD 706.4 2,373.9 2,964.1 6.2 3.2<br />
Latin America 33.1 103.0 116.9 5.8 1.8<br />
Middle East & Africa 30.2 55.7 96.2 3.1 8.1<br />
South Asia 18.5 49.4 100.8 5.0 10.7<br />
Southeast Asia 43.8 228.9 340.6 8.6 5.8<br />
China n/a 82.7 273.4 n/a 18.6<br />
OPEC 23.3 39.3 176.6 2.6 23.9<br />
Developing countries 148.9 559.0 1,104.5 6.8 10.2<br />
Russia n/a 25.9 80.1 n/a 17.5<br />
Other trans. economies 3.2 20.2 31.5 9.7 6.6<br />
Transition economies n/a 46.1 111.6 n/a 13.5<br />
World n/a 2,979.0 4,180.2 n/a 5.0<br />
Source: ICAO online database, www.icaodata.com.<br />
93<br />
Chapter<br />
2