Section One
Section One
Section One

You also want an ePaper? Increase the reach of your titles
YUMPU automatically turns print PDFs into web optimized ePapers that Google loves.
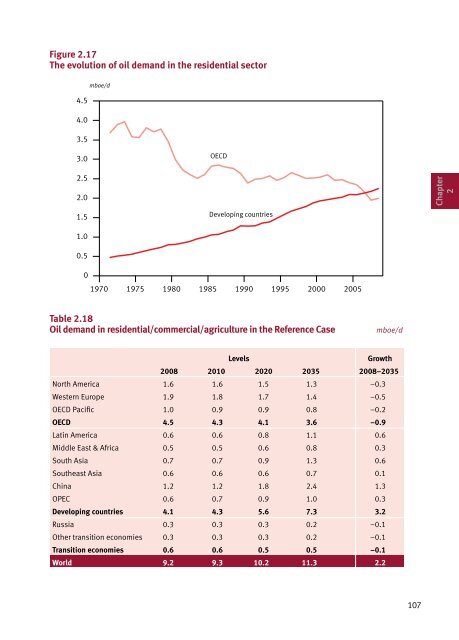
Figure 2.17<br />
The evolution of oil demand in the residential Figure sector 2.17<br />
4.5<br />
4.0<br />
3.5<br />
3.0<br />
2.5<br />
2.0<br />
1.5<br />
1.0<br />
0.5<br />
mboe/d<br />
OECD<br />
Developing countries<br />
0<br />
1970 1975 1980 1985 1990 1995 2000 2005<br />
Table 2.18<br />
Oil demand in residential/commercial/agriculture in the Reference Case mboe/d<br />
Levels Figure Growth 2.19<br />
2008 2010 2020 2035 2008–2035<br />
North America 1.6 1.6 1.5 1.3 –0.3<br />
Western Europe 1.9 1.8 1.7 1.4 –0.5<br />
OECD Pacific 1.0 0.9 0.9 0.8 –0.2<br />
OECD 4.5 4.3 4.1 3.6 –0.9<br />
Latin America 0.6 OPEC 0.6 0.8 1.1 0.6<br />
Middle East & Africa<br />
South Asia<br />
0.5<br />
OECD Pacific<br />
0.7<br />
0.5<br />
0.7<br />
0.6<br />
0.9<br />
0.8<br />
1.3<br />
0.3<br />
0.6<br />
Southeast Asia North 0.6 America 0.6 0.6 0.7 0.1<br />
China<br />
OPEC<br />
1.2<br />
Latin America<br />
0.6<br />
1.2<br />
0.7<br />
1.8<br />
0.9<br />
2.4<br />
1.0<br />
1.3<br />
0.3<br />
Developing countries Middle East 4.1 and Africa 4.3 5.6 7.3 3.2<br />
Russia 0.3<br />
Western Europe<br />
Other transition economies 0.3<br />
0.3<br />
0.3<br />
0.3<br />
0.3<br />
0.2<br />
0.2<br />
–0.1<br />
–0.1<br />
Transition economies Southeast 0.6 Asia 0.6 0.5 0.5 –0.1<br />
World 9.2<br />
South Asia<br />
9.3 10.2 11.3 2.2<br />
Russia<br />
China<br />
Other trans. economies<br />
107<br />
Chapter<br />
2