Section One
Section One
Section One

You also want an ePaper? Increase the reach of your titles
YUMPU automatically turns print PDFs into web optimized ePapers that Google loves.
64<br />
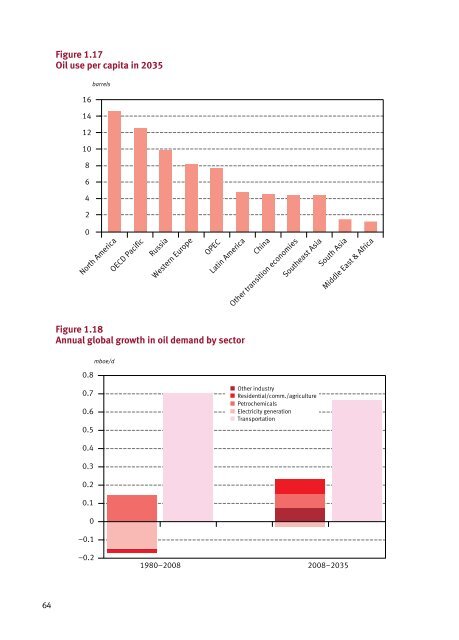
Figure 1.17<br />
Oil use per capita in 2035<br />
16<br />
30<br />
14<br />
25 12<br />
10<br />
20<br />
8<br />
156<br />
4<br />
10<br />
2<br />
5<br />
0<br />
0<br />
–5<br />
barrels<br />
North America<br />
0.8<br />
58<br />
0.7<br />
57<br />
0.6<br />
56<br />
0.5<br />
0.4 55<br />
0.3 54<br />
0.2<br />
53<br />
0.1<br />
52<br />
0<br />
51<br />
–0.1<br />
–0.2 50<br />
mb/d<br />
mboe/d<br />
mb/d<br />
mb/d<br />
OECD oil demand<br />
peaked in 2005<br />
OECD Pacific<br />
Russia<br />
North America<br />
Western Europe<br />
OECD Pacific<br />
Western Europe<br />
80% of the<br />
growth in oil<br />
demand is in<br />
developing Asia<br />
OPEC<br />
Latin America<br />
Figure 1.18<br />
Annual global growth in oil demand by<br />
Figure<br />
sector<br />
1.18<br />
China<br />
Other transition economies<br />
Figure 1.17<br />
Figure 1.16<br />
OPEC<br />
China<br />
Southeast Asia<br />
South Asia<br />
Middle East & Africa<br />
Latin America<br />
Southeast Asia<br />
South Asia<br />
OECD and transition economy countries Developing countries<br />
Other industry<br />
Residential/comm./agriculture<br />
Petrochemicals<br />
Electricity generation<br />
Transportation<br />
Middle East & Africa<br />
2007 1980–20082008 2009 20102008–20352011 Figure 1.19<br />
Figure 1.21 (new)<br />
Figure 1.20<br />
Year of WOO