Section One
Section One
Section One

Create successful ePaper yourself
Turn your PDF publications into a flip-book with our unique Google optimized e-Paper software.
The Reference Case outlook for oil demand levels and growth rates in this sector<br />
are shown in Tables 2.10 and 2.11. As in the past, China is key to future growth, with<br />
demand increasing by close to 1 mboe/d over the period 2008–2035, which represents<br />
82% of the global increase.<br />
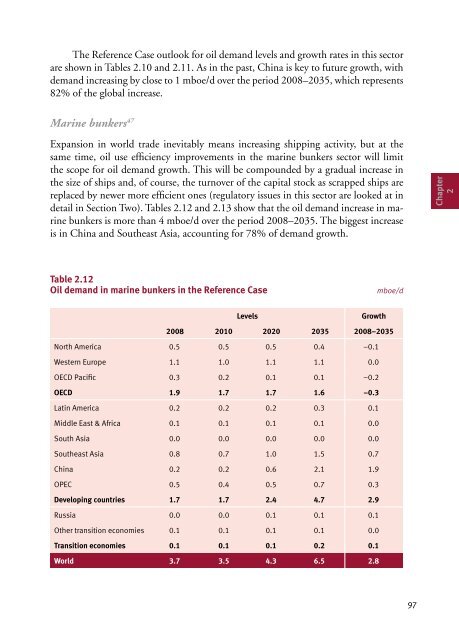
Marine bunkers 47<br />
Expansion in world trade inevitably means increasing shipping activity, but at the<br />
same time, oil use efficiency improvements in the marine bunkers sector will limit<br />
the scope for oil demand growth. This will be compounded by a gradual increase in<br />
the size of ships and, of course, the turnover of the capital stock as scrapped ships are<br />
replaced by newer more efficient ones (regulatory issues in this sector are looked at in<br />
detail in <strong>Section</strong> Two). Tables 2.12 and 2.13 show that the oil demand increase in marine<br />
bunkers is more than 4 mboe/d over the period 2008–2035. The biggest increase<br />
is in China and Southeast Asia, accounting for 78% of demand growth.<br />
Table 2.12<br />
Oil demand in marine bunkers in the Reference Case mboe/d<br />
Levels Growth<br />
2008 2010 2020 2035 2008–2035<br />
North America 0.5 0.5 0.5 0.4 –0.1<br />
Western Europe 1.1 1.0 1.1 1.1 0.0<br />
OECD Pacific 0.3 0.2 0.1 0.1 –0.2<br />
OECD 1.9 1.7 1.7 1.6 –0.3<br />
Latin America 0.2 0.2 0.2 0.3 0.1<br />
Middle East & Africa 0.1 0.1 0.1 0.1 0.0<br />
South Asia 0.0 0.0 0.0 0.0 0.0<br />
Southeast Asia 0.8 0.7 1.0 1.5 0.7<br />
China 0.2 0.2 0.6 2.1 1.9<br />
OPEC 0.5 0.4 0.5 0.7 0.3<br />
Developing countries 1.7 1.7 2.4 4.7 2.9<br />
Russia 0.0 0.0 0.1 0.1 0.1<br />
Other transition economies 0.1 0.1 0.1 0.1 0.0<br />
Transition economies 0.1 0.1 0.1 0.2 0.1<br />
World 3.7 3.5 4.3 6.5 2.8<br />
97<br />
Chapter<br />
2