Section One
Section One
Section One

You also want an ePaper? Increase the reach of your titles
YUMPU automatically turns print PDFs into web optimized ePapers that Google loves.
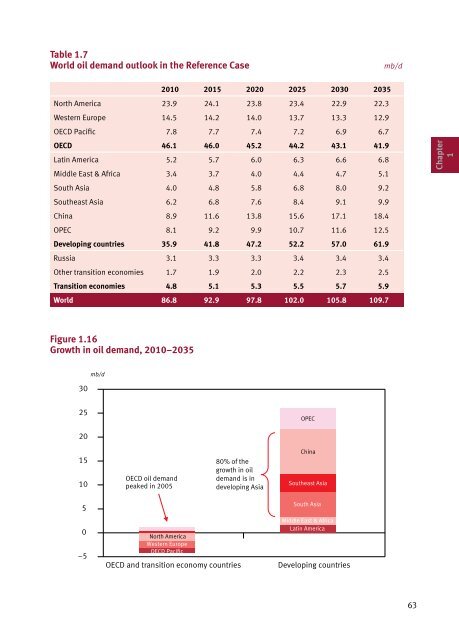
Table 1.7<br />
World oil demand outlook in the Reference Case mb/d<br />
Figure 1.16<br />
Growth in oil demand, 2010–2035<br />
30<br />
25<br />
20<br />
15<br />
10<br />
5<br />
0<br />
–5<br />
mb/d<br />
OECD oil demand<br />
peaked in 2005<br />
2010 2015 2020 2025 2030 2035<br />
North America 23.9 24.1 23.8 23.4 22.9 22.3<br />
Western Europe 14.5 14.2 14.0 13.7 13.3 12.9<br />
OECD Pacific 7.8 7.7 7.4 7.2 6.9 6.7<br />
OECD 46.1 46.0 45.2 44.2 43.1 41.9<br />
Latin America 5.2 5.7 6.0 6.3 6.6 6.8<br />
Middle East & Africa 3.4 3.7 4.0 4.4 4.7 5.1<br />
South Asia 4.0 4.8 5.8 6.8 8.0 9.2<br />
Southeast Asia 6.2 6.8 7.6 8.4 9.1 9.9<br />
China 8.9 11.6 13.8 15.6 17.1 18.4<br />
OPEC 8.1 9.2 9.9 10.7 11.6 12.5<br />
Developing countries 35.9 41.8 47.2 52.2 57.0 61.9<br />
Russia 3.1 3.3 3.3 3.4 3.4 3.4<br />
Other transition economies 1.7 1.9 2.0 2.2 2.3 2.5<br />
Transition economies 4.8 5.1 5.3 5.5 5.7 5.9<br />
World 86.8 92.9 97.8 102.0 105.8 109.7<br />
North America<br />
Western Europe<br />
OECD Pacific<br />
80% of the<br />
growth in oil<br />
demand is in<br />
developing Asia<br />
Figure 1.18<br />
OPEC<br />
China<br />
Southeast Asia<br />
South Asia<br />
Middle East & Africa<br />
Latin America<br />
Figure 1.16<br />
OECD and transition economy countries Developing countries<br />
63<br />
Chapter<br />
1