SUbstance flow analysis of the recycling of small waste electrical ...
SUbstance flow analysis of the recycling of small waste electrical ...
SUbstance flow analysis of the recycling of small waste electrical ...
You also want an ePaper? Increase the reach of your titles
YUMPU automatically turns print PDFs into web optimized ePapers that Google loves.
16<br />
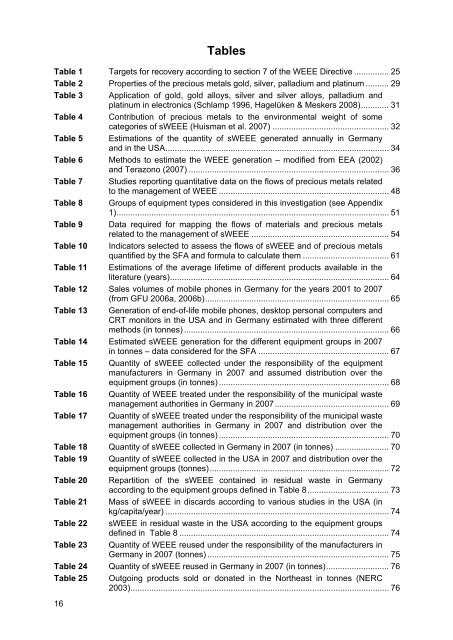
Tables<br />
Table 1 Targets for recovery according to section 7 <strong>of</strong> <strong>the</strong> WEEE Directive ............... 25<br />
Table 2 Properties <strong>of</strong> <strong>the</strong> precious metals gold, silver, palladium and platinum .......... 29<br />
Table 3 Application <strong>of</strong> gold, gold alloys, silver and silver alloys, palladium and<br />
platinum in electronics (Schlamp 1996, Hagelüken & Meskers 2008) ............ 31<br />
Table 4 Contribution <strong>of</strong> precious metals to <strong>the</strong> environmental weight <strong>of</strong> some<br />
categories <strong>of</strong> sWEEE (Huisman et al. 2007) .................................................. 32<br />
Table 5 Estimations <strong>of</strong> <strong>the</strong> quantity <strong>of</strong> sWEEE generated annually in Germany<br />
and in <strong>the</strong> USA ................................................................................................ 34<br />
Table 6 Methods to estimate <strong>the</strong> WEEE generation – modified from EEA (2002)<br />
and Terazono (2007) ...................................................................................... 36<br />
Table 7 Studies reporting quantitative data on <strong>the</strong> <strong>flow</strong>s <strong>of</strong> precious metals related<br />
to <strong>the</strong> management <strong>of</strong> WEEE ......................................................................... 48<br />
Table 8 Groups <strong>of</strong> equipment types considered in this investigation (see Appendix<br />
1) ..................................................................................................................... 51<br />
Table 9 Data required for mapping <strong>the</strong> <strong>flow</strong>s <strong>of</strong> materials and precious metals<br />
related to <strong>the</strong> management <strong>of</strong> sWEEE ........................................................... 54<br />
Table 10 Indicators selected to assess <strong>the</strong> <strong>flow</strong>s <strong>of</strong> sWEEE and <strong>of</strong> precious metals<br />
quantified by <strong>the</strong> SFA and formula to calculate <strong>the</strong>m ..................................... 61<br />
Table 11 Estimations <strong>of</strong> <strong>the</strong> average lifetime <strong>of</strong> different products available in <strong>the</strong><br />
literature (years).............................................................................................. 64<br />
Table 12 Sales volumes <strong>of</strong> mobile phones in Germany for <strong>the</strong> years 2001 to 2007<br />
(from GFU 2006a, 2006b) ............................................................................... 65<br />
Table 13 Generation <strong>of</strong> end-<strong>of</strong>-life mobile phones, desktop personal computers and<br />
CRT monitors in <strong>the</strong> USA and in Germany estimated with three different<br />
methods (in tonnes) ........................................................................................ 66<br />
Table 14 Estimated sWEEE generation for <strong>the</strong> different equipment groups in 2007<br />
in tonnes – data considered for <strong>the</strong> SFA ........................................................ 67<br />
Table 15 Quantity <strong>of</strong> sWEEE collected under <strong>the</strong> responsibility <strong>of</strong> <strong>the</strong> equipment<br />
manufacturers in Germany in 2007 and assumed distribution over <strong>the</strong><br />
equipment groups (in tonnes) ......................................................................... 68<br />
Table 16 Quantity <strong>of</strong> WEEE treated under <strong>the</strong> responsibility <strong>of</strong> <strong>the</strong> municipal <strong>waste</strong><br />
management authorities in Germany in 2007 ................................................. 69<br />
Table 17 Quantity <strong>of</strong> sWEEE treated under <strong>the</strong> responsibility <strong>of</strong> <strong>the</strong> municipal <strong>waste</strong><br />
management authorities in Germany in 2007 and distribution over <strong>the</strong><br />
equipment groups (in tonnes) ......................................................................... 70<br />
Table 18 Quantity <strong>of</strong> sWEEE collected in Germany in 2007 (in tonnes) ....................... 70<br />
Table 19 Quantity <strong>of</strong> sWEEE collected in <strong>the</strong> USA in 2007 and distribution over <strong>the</strong><br />
equipment groups (tonnes)............................................................................. 72<br />
Table 20 Repartition <strong>of</strong> <strong>the</strong> sWEEE contained in residual <strong>waste</strong> in Germany<br />
according to <strong>the</strong> equipment groups defined in Table 8 ................................... 73<br />
Table 21 Mass <strong>of</strong> sWEEE in discards according to various studies in <strong>the</strong> USA (in<br />
kg/capita/year) ................................................................................................ 74<br />
Table 22 sWEEE in residual <strong>waste</strong> in <strong>the</strong> USA according to <strong>the</strong> equipment groups<br />
defined in Table 8 .......................................................................................... 74<br />
Table 23 Quantity <strong>of</strong> WEEE reused under <strong>the</strong> responsibility <strong>of</strong> <strong>the</strong> manufacturers in<br />
Germany in 2007 (tonnes) .............................................................................. 75<br />
Table 24 Quantity <strong>of</strong> sWEEE reused in Germany in 2007 (in tonnes) ........................... 76<br />
Table 25 Outgoing products sold or donated in <strong>the</strong> Nor<strong>the</strong>ast in tonnes (NERC<br />
2003) ............................................................................................................... 76


