SUbstance flow analysis of the recycling of small waste electrical ...
SUbstance flow analysis of the recycling of small waste electrical ...
SUbstance flow analysis of the recycling of small waste electrical ...

Create successful ePaper yourself
Turn your PDF publications into a flip-book with our unique Google optimized e-Paper software.
34 Substance <strong>flow</strong> <strong>analysis</strong> <strong>of</strong> <strong>the</strong> <strong>recycling</strong> <strong>of</strong> <strong>small</strong> WEEE<br />
estimates explain <strong>the</strong> diverging results (Widmer et al. 2005). It is difficult to measure or<br />
estimate actual WEEE generation, since <strong>the</strong> routes for disposal are manifold (Huisman et al.<br />
2007).<br />
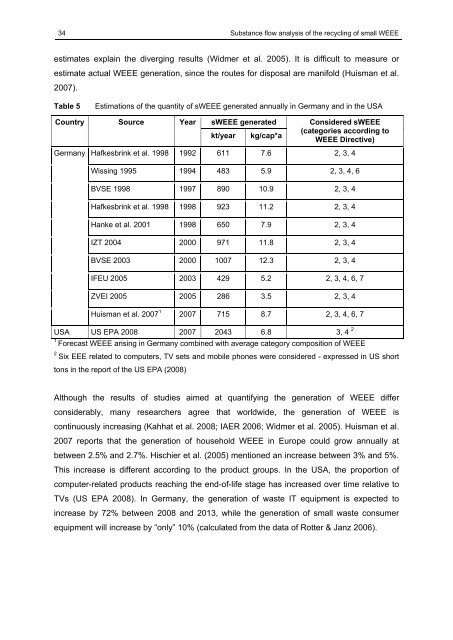
Table 5<br />
Estimations <strong>of</strong> <strong>the</strong> quantity <strong>of</strong> sWEEE generated annually in Germany and in <strong>the</strong> USA<br />
Country Source Year sWEEE generated Considered sWEEE<br />
(categories according to<br />
kt/year kg/cap*a<br />
WEEE Directive)<br />
Germany Hafkesbrink et al. 1998 1992 611 7.6 2, 3, 4<br />
Wissing 1995 1994 483 5.9 2, 3, 4, 6<br />
BVSE 1998 1997 890 10.9 2, 3, 4<br />
Hafkesbrink et al. 1998 1998 923 11.2 2, 3, 4<br />
Hanke et al. 2001 1998 650 7.9 2, 3, 4<br />
IZT 2004 2000 971 11.8 2, 3, 4<br />
BVSE 2003 2000 1007 12.3 2, 3, 4<br />
IFEU 2005 2003 429 5.2 2, 3, 4, 6, 7<br />
ZVEI 2005 2005 286 3.5 2, 3, 4<br />
Huisman et al. 2007 1 2007 715 8.7 2, 3, 4, 6, 7<br />
USA US EPA 2008 2007 2043 6.8 3, 4 2<br />
1<br />
Forecast WEEE arising in Germany combined with average category composition <strong>of</strong> WEEE<br />
2<br />
Six EEE related to computers, TV sets and mobile phones were considered - expressed in US short<br />
tons in <strong>the</strong> report <strong>of</strong> <strong>the</strong> US EPA (2008)<br />
Although <strong>the</strong> results <strong>of</strong> studies aimed at quantifying <strong>the</strong> generation <strong>of</strong> WEEE differ<br />
considerably, many researchers agree that worldwide, <strong>the</strong> generation <strong>of</strong> WEEE is<br />
continuously increasing (Kahhat et al. 2008; IAER 2006; Widmer et al. 2005). Huisman et al.<br />
2007 reports that <strong>the</strong> generation <strong>of</strong> household WEEE in Europe could grow annually at<br />
between 2.5% and 2.7%. Hischier et al. (2005) mentioned an increase between 3% and 5%.<br />
This increase is different according to <strong>the</strong> product groups. In <strong>the</strong> USA, <strong>the</strong> proportion <strong>of</strong><br />
computer-related products reaching <strong>the</strong> end-<strong>of</strong>-life stage has increased over time relative to<br />
TVs (US EPA 2008). In Germany, <strong>the</strong> generation <strong>of</strong> <strong>waste</strong> IT equipment is expected to<br />
increase by 72% between 2008 and 2013, while <strong>the</strong> generation <strong>of</strong> <strong>small</strong> <strong>waste</strong> consumer<br />
equipment will increase by “only” 10% (calculated from <strong>the</strong> data <strong>of</strong> Rotter & Janz 2006).