

monitoring
monitoring
monitoring

You also want an ePaper? Increase the reach of your titles
YUMPU automatically turns print PDFs into web optimized ePapers that Google loves.
UNCLASSIFIED<br />
DEFENSE SCIENCE BOARD | DEPARTMENT OF DEFENSE<br />
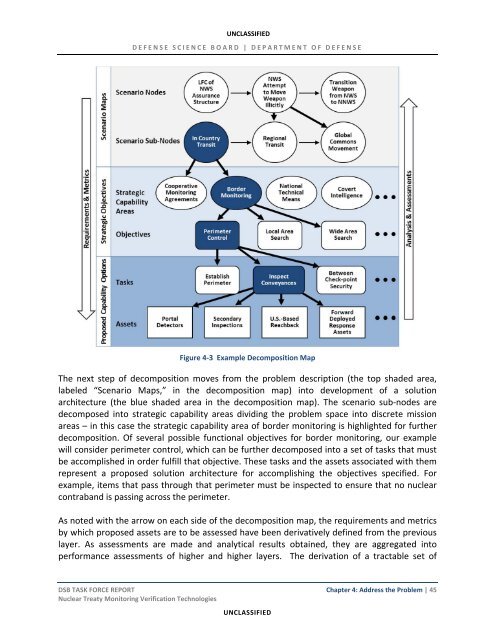
Figure 4‐3 Example Decomposition Map<br />
The next step of decomposition moves from the problem description (the top shaded area,<br />
labeled “Scenario Maps,” in the decomposition map) into development of a solution<br />
architecture (the blue shaded area in the decomposition map). The scenario sub‐nodes are<br />
decomposed into strategic capability areas dividing the problem space into discrete mission<br />
areas – in this case the strategic capability area of border <strong>monitoring</strong> is highlighted for further<br />
decomposition. Of several possible functional objectives for border <strong>monitoring</strong>, our example<br />
will consider perimeter control, which can be further decomposed into a set of tasks that must<br />
be accomplished in order fulfill that objective. These tasks and the assets associated with them<br />
represent a proposed solution architecture for accomplishing the objectives specified. For<br />
example, items that pass through that perimeter must be inspected to ensure that no nuclear<br />
contraband is passing across the perimeter.<br />
As noted with the arrow on each side of the decomposition map, the requirements and metrics<br />
by which proposed assets are to be assessed have been derivatively defined from the previous<br />
layer. As assessments are made and analytical results obtained, they are aggregated into<br />
performance assessments of higher and higher layers. The derivation of a tractable set of<br />
DSB TASK FORCE REPORT Chapter 4: Address the Problem | 45<br />
Nuclear Treaty Monitoring Verification Technologies<br />
UNCLASSIFIED