- Page 1 and 2:
Social Impact Assessment of Microfi
- Page 3 and 4:
indicators which are more difficult
- Page 5 and 6:
• Since Asasah has been in operat
- Page 7 and 8:
Akhuwat • Akhuwat was established
- Page 9 and 10: and economic change in their surrou
- Page 11 and 12: development. NRSP's mandate is to h
- Page 13 and 14: Kashf Urban Poverty Alleviation Pro
- Page 15 and 16: clients’ amounts to Rs.5.6 millio
- Page 17 and 18: Pakistan, Official Poverty Line - R
- Page 19 and 20: Contents Executive Summary Acknowle
- Page 21 and 22: 7.5 UPAP Survey Results 7.6 UPAP Re
- Page 23 and 24: microfinance operations. This ordin
- Page 25 and 26: and not other services such as savi
- Page 27 and 28: elow. While we examined the traditi
- Page 29 and 30: Ideally, baseline studies and panel
- Page 31 and 32: members of these organizations are
- Page 33 and 34: Microfinance Branch District/City I
- Page 35 and 36: factor. For this survey, the sample
- Page 37 and 38: loans and might have increased cons
- Page 39 and 40: Chapter Three: Asasah 3.1 Instituti
- Page 41 and 42: insufficient resources. Furthermore
- Page 43 and 44: Figure 3.1: Asasah’s Target Marke
- Page 45 and 46: for SBF, two in Lahore and one in K
- Page 47 and 48: to Regional Managers as the organiz
- Page 49 and 50: undertake thorough research which e
- Page 51 and 52: According to Asasah the only time a
- Page 53 and 54: Figure 3.3 Funding Sources NGO 5% D
- Page 55 and 56: Borrower’, is that client who has
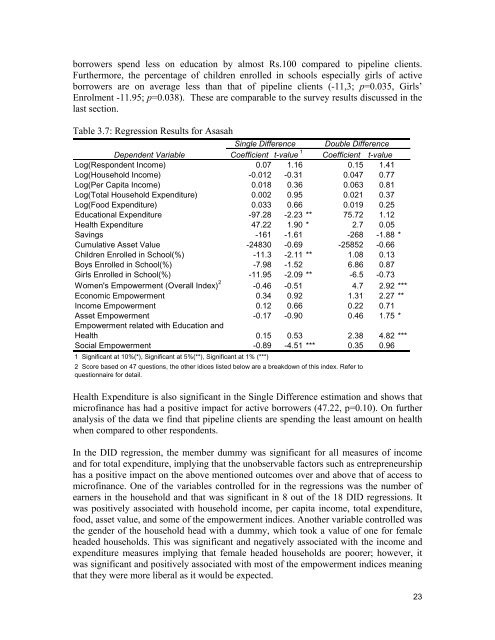
- Page 57 and 58: Note: There are 237 and 273 respond
- Page 59: Note: There are 237 and 273 respond
- Page 63 and 64: Jewellery and livestock were genera
- Page 65 and 66: Appendix Chapter 3 A 3.1.1 Institut
- Page 67 and 68: A3.1.4 Organizational Structure Boa
- Page 69 and 70: Table - A.3.2.4 Respondent Characte
- Page 71 and 72: Table - A.3.2.9 Child Education [AS
- Page 73 and 74: Table - A.3.2.14 Household Assets O
- Page 75 and 76: Table - A.3.2.17 Women’s Empowerm
- Page 77 and 78: Table - A.3.2.20 Women’s Empowerm
- Page 79 and 80: Table - A.3.2.22 Borrowers - Loan A
- Page 81 and 82: Table - A.3.2.27 Non-Borrowers’ P
- Page 83 and 84: Chapter Four: Orangi Charitable Tru
- Page 85 and 86: these, as many as 7,301 units are c
- Page 87 and 88: • Loan for Livestock: OCT also su
- Page 89 and 90: guarantees of two local entrepreneu
- Page 91 and 92: CEBEMO, a Dutch funding agency, has
- Page 93 and 94: MFIs claim. Hence, its criteria and
- Page 95 and 96: Table - 4.4 OCT - Household Assets
- Page 97 and 98: difference, we found that active bo
- Page 99 and 100: mainly because they don’t have to
- Page 101 and 102: Term/D uration Loan size improveme
- Page 103 and 104: Table - A. 4.2.4 Respondent Charact
- Page 105 and 106: Average Indebtedness 19300 6375 340
- Page 107 and 108: Table - A. 4.2.14 Household Assets
- Page 109 and 110: Table - A. 4.2.19 Borrowers’ Perc
- Page 111 and 112:
Table - A. 4.2.23 Non-Borrowers’
- Page 113 and 114:
which also became the head office.
- Page 115 and 116:
problem of group lending is that me
- Page 117 and 118:
uy insurance, which covers the risk
- Page 119 and 120:
activities with other NGOs and Soci
- Page 121 and 122:
5.1.5.3 Policy Environment As Akhuw
- Page 123 and 124:
are also working on a marketing pla
- Page 125 and 126:
We first discuss results based on t
- Page 127 and 128:
New and Non- Borrowers 506072.7273
- Page 129 and 130:
Note: There are 160 and 180 respond
- Page 131 and 132:
From these results we can judge tha
- Page 133 and 134:
Appendix Chapter 5 A 5..11 Institut
- Page 135 and 136:
Table - 5.4.2.1 Sample Information
- Page 137 and 138:
Table - A. 5.2.6 Housing Characteri
- Page 139 and 140:
Table - A. 5.2.12 Sources of Househ
- Page 141 and 142:
Table - A. 5.2.16 Women’s Empower
- Page 143 and 144:
Table - A. 5.2.18 Women’s Empower
- Page 145 and 146:
Table - A. 5.2.21 Women’s Empower
- Page 147 and 148:
Table - A. 5.2.25 Borrowers’ Perc
- Page 149 and 150:
Table - A. 5.2.29 Non-Borrower’s
- Page 151 and 152:
in the contextual needs of the comm
- Page 153 and 154:
6.1.4.1 Products and Services Offer
- Page 155 and 156:
Other filters related to the specif
- Page 157 and 158:
management reveal the significance
- Page 159 and 160:
have been chosen from ‘old/establ
- Page 161 and 162:
School Going Children - Boys % Acti
- Page 163 and 164:
The Difference in Differences (DID)
- Page 165 and 166:
Table 1: Regression results Young B
- Page 167 and 168:
• Participants were also not very
- Page 169 and 170:
Impact on Quality of Life & Social
- Page 171 and 172:
Appendix Chapter 6 A.6.1.1 Institut
- Page 173 and 174:
Sample Information [SAFWCO] Table -
- Page 175 and 176:
Table - A. 6.2.7 Housing Characteri
- Page 177 and 178:
Table - A. 6.2.12 Sources of Househ
- Page 179 and 180:
Table - A. 6.2.16 Women’s Empower
- Page 181 and 182:
Table - A. 6.2.18 Women’s Empower
- Page 183 and 184:
Table - A. 6.2.21 Women’s Empower
- Page 185 and 186:
Table - A. 6.2.25 Borrowers’ Perc
- Page 187 and 188:
Table - A. 6.2.29 Non-Borrowers’
- Page 189 and 190:
incremental growth, it is emerging
- Page 191 and 192:
the purpose of the organization and
- Page 193 and 194:
Group loans are meant specifically
- Page 195 and 196:
Officer. If the Field Worker and Cr
- Page 197 and 198:
The worker’s degree of mobility d
- Page 199 and 200:
credit is disbursed to another woma
- Page 201 and 202:
Borrowers Houses with RCC Roof Acti
- Page 203 and 204:
Own House Active Borrowers 98.4568
- Page 205 and 206:
A Single Difference equation is als
- Page 208 and 209:
Table 7.6: Regression results Young
- Page 210 and 211:
Table - 7.8 UPAP - Economic Status
- Page 212 and 213:
Table - 7.10 UPAP - Household Asset
- Page 214 and 215:
Y ij = X ij α + C ij β + M ij γ
- Page 216 and 217:
Table 1: Regression results Young B
- Page 218 and 219:
to consider young unmarried clients
- Page 220 and 221:
influentials and people understand
- Page 222 and 223:
Client Profile Most of the women in
- Page 224 and 225:
Appendix Chapter 7 Appendix A.7.1 N
- Page 226 and 227:
Appendix A.7.2 Results from NRSP Su
- Page 228 and 229:
Table - A. 7.2.6 Housing Characteri
- Page 230 and 231:
Monthly Expenditure on Health 1526
- Page 232 and 233:
Table - A. 7.2.16 Women’s Empower
- Page 234 and 235:
Do you operate Bank account in your
- Page 236 and 237:
Spouse without your suggestion .6 3
- Page 238 and 239:
No 17.6 14.1 20.3 9.6 16.7 100.0 15
- Page 240 and 241:
Appendix A.7.3 UPAP Institutional B
- Page 242 and 243:
Table - A.7. 4.4 Respondent Charact
- Page 244 and 245:
Table - A.7. 4.9 Child Education [U
- Page 246 and 247:
Table - A.7. 4.14 Household Assets
- Page 248 and 249:
Table - A.7. 4.17 Women’s Empower
- Page 250 and 251:
Table - A.7. 4.20 Women’s Empower
- Page 252 and 253:
Table - A.7. 4.23 Borrowers - Loan
- Page 254 and 255:
Table - A.7. 4.27 Non-Borrower’s
- Page 256 and 257:
Chapter Eight: Kashf 8.1 Institutio
- Page 258 and 259:
were introduced at several levels a
- Page 260 and 261:
Box 8.1 Kashf’s Core Values Servi
- Page 262 and 263:
issues are in the social theme book
- Page 264 and 265:
usiness address, attest to experien
- Page 266 and 267:
the learning centre has been set up
- Page 268 and 269:
development and undertaken market s
- Page 270 and 271:
information has not been integrated
- Page 272 and 273:
Table 8. 2 Financing Sources: Septe
- Page 274 and 275:
We first discuss results based on t
- Page 276 and 277:
Note: There are 239 and 271 respond
- Page 278 and 279:
Table - 8.7 KASHF - Business Charac
- Page 280 and 281:
The results from the estimation of
- Page 282 and 283:
A total of three focus group discus
- Page 284 and 285:
The positive impact of the credit w
- Page 286 and 287:
Appendix Chapter 8 A.8.1.1 Institut
- Page 288 and 289:
54 Jawarian R 55 Behra R 56 Sahiwal
- Page 290 and 291:
A.8.1.5: GESA Activities Initiative
- Page 292 and 293:
Table - A.8.2.1 Sample Information
- Page 294 and 295:
Table - A. 8.2.6 Housing Characteri
- Page 296 and 297:
Table - A. 8.2.12 Sources of Househ
- Page 298 and 299:
Table - A. 8.2.16 Women’s Empower
- Page 300 and 301:
Table - A. 8.2.18 Women’s Empower
- Page 302 and 303:
Table - A. 8.2.20 Women’s Empower
- Page 304 and 305:
Table - A. 8.2.22 Borrowers - Loan
- Page 306 and 307:
Table - A. 8.2.27 Non-Borrowers’
- Page 308 and 309:
Chapter Nine: Conclusions For anyon
- Page 310 and 311:
are necessary for impact to take pl
- Page 312 and 313:
Another finding from the survey sug
- Page 314 and 315:
of the microfinance sector in Pakis
- Page 316 and 317:
Section 1 - IDENTIFICATION File:
- Page 318 and 319:
1.9 Occupation - Primary __________
- Page 320 and 321:
Section 4a - All Respondents File:
- Page 322 and 323:
Section 4b - All Respondents File:
- Page 324 and 325:
Section 5b - All Respondents File:
- Page 326 and 327:
Section 7 - Only for Non-Agricultur
- Page 328 and 329:
8) Do you regularly pay the loan in
- Page 330 and 331:
Section 9 - All Respondents File:
- Page 332 and 333:
10.2 Had you wanted to join a progr
- Page 334 and 335:
11.7 Business Assets Business Asset
- Page 336 and 337:
Section 14 - All Respondents File:
- Page 338 and 339:
Section 16,17,18 - All Respondents
- Page 340 and 341:
17.2 [If Yes in 17.1], Why you did
- Page 342 and 343:
Section 19 - Only for Female Respon
- Page 344 and 345:
19.8 Who in your household decides
- Page 346 and 347:
Section 20a - Only for Agricultural
- Page 348 and 349:
Section 20b - Only for Agricultural
- Page 350 and 351:
Page is left intentionally blank Qu
- Page 352 and 353:
Appendix: Additional Codes ________
- Page 354 and 355:
___________________________________
- Page 356 and 357:
___________________________________
- Page 358 and 359:
Bibliography Carolyn Barnes and Jen