- Page 1 and 2:
The Mobile Internet Report Key Them
- Page 3 and 4:
What You are Reading - The Mobile I
- Page 5 and 6:
Key Mobile Internet Themes 1) Wealt
- Page 7 and 8:
…Key Mobile Internet Themes… 3)
- Page 9 and 10:
…Key Mobile Internet Themes 6) Ma
- Page 11 and 12:
Key Theme #1 11
- Page 13 and 14:
Key Theme #1 - Wealth Creation / De
- Page 15 and 16:
Wealth Creation / Destruction Is Ma
- Page 17 and 18:
Winners of Each New Cycle Often Cre
- Page 19 and 20:
NCR Won Big in Mainframe Era, DEC W
- Page 21 and 22:
Compaq + Microsoft Won Big in PC Er
- Page 23 and 24:
Net, New Computing Cycles Create /
- Page 25 and 26:
New Computing Cycle Characteristics
- Page 27 and 28:
12,000,000 Mobile Internet Traffic
- Page 29 and 30:
Pace of company change related to m
- Page 31 and 32:
Rapid Pace of Corporate M&A Related
- Page 33 and 34:
Technology Companies Created > Weal
- Page 35 and 36:
Top Internet-Related Tech Wealth Cr
- Page 37 and 38:
We Know What Happened Over Past 15
- Page 39 and 40:
Mobile Internet Likely to Follow Ti
- Page 41 and 42:
2009 Global Top 30 TMT Companies by
- Page 43 and 44:
Key Theme #2 43
- Page 45 and 46:
Key Theme #2 - Mobile Ramping Faste
- Page 47 and 48:
Apple iPhone + iTouch = Fastest new
- Page 49 and 50:
Mobile Internet Outpaces Desktop In
- Page 51 and 52:
Tech Cycles Tend to Last Ten Years
- Page 53 and 54:
User-Interface Revolutions (Overlai
- Page 55 and 56:
Broad base of IP-based mobile usage
- Page 57 and 58:
Wireless Network Primer GPS - Glob
- Page 59 and 60:
Increasingly, Mobile Phone Usage is
- Page 61 and 62:
Mobile Devices + Infrastructure Ena
- Page 63 and 64:
Cloud-Based Content / App Services
- Page 65 and 66:
Machine to Machine (M2M) Takes on N
- Page 67 and 68:
Rapid growth in number / type of mo
- Page 69 and 70:
GPS proliferation (and related loca
- Page 71 and 72:
GPS = 421MM Chipsets Sold in 2008E
- Page 73 and 74:
WIRED Magazine - “Inside the GPS
- Page 75 and 76:
3G proliferation is a big deal. 75
- Page 77 and 78:
3G = Key to Enabling Internet Usage
- Page 79 and 80:
3G Penetration Inflection Points Va
- Page 81 and 82:
3G Growth Still Concentrated in Dev
- Page 83 and 84:
USA Likely to Remain Most Dynamic 3
- Page 85 and 86:
Wi-Fi proliferation is a big deal.
- Page 87 and 88:
Wi-Fi’s High Speed + Wide Availab
- Page 89 and 90:
100,000 Wi-Fi Households (USA) = 20
- Page 91 and 92:
Bluetooth proliferation is a big de
- Page 93 and 94:
Bluetooth = 1.3B Chipsets Sold in 2
- Page 95 and 96:
What Is a ‘Smartphone’ We defi
- Page 97 and 98:
Smartphone of 2009 = As Powerful as
- Page 99 and 100:
Mobile Internet - Leveraging the Ev
- Page 101 and 102:
Notebook PC + Smartphone Shipments
- Page 103 and 104:
Impressive / Rapid Growing Smartpho
- Page 105 and 106:
Consumer Internet-Enabled Devices -
- Page 107 and 108:
Significant Growth in 3G + Smartpho
- Page 109 and 110:
Unified Communication (UC) Voice (~
- Page 111 and 112:
If VoIP Leader Skype Were a Carrier
- Page 113 and 114:
VoIP = Material Impact on Tradition
- Page 115 and 116:
Google Voice Putting User in Contro
- Page 117 and 118:
Social Networking - Global Phenomen
- Page 119 and 120:
Facebook = Garnering Rising Share o
- Page 121 and 122:
Powerful Devices (like iPhone) + Ne
- Page 123 and 124:
Video = High Usage + High Bandwidth
- Page 125 and 126:
Mobile Ramping Faster than Desktop
- Page 127 and 128:
Key Theme #3 1) Wealth Creation / D
- Page 129 and 130:
Apple Leading in Mobile Innovation
- Page 131 and 132:
Apple’s Impressive Share Likely M
- Page 133 and 134:
iTunes App Store = Shot Heard ‘Ro
- Page 135 and 136:
iTunes App Store = The Killer Mobil
- Page 137 and 138:
Mobile App Definition A mobile appl
- Page 139 and 140:
Users / Developers / Apple = Likely
- Page 141 and 142:
Apple iPhone / iTouch = 2B+ App Dow
- Page 143 and 144:
Most Downloaded Free iPhone Apps -
- Page 145 and 146:
iPhone Apps for Nearly Everyone - L
- Page 147 and 148:
Mobile Developer Mind Share / Focus
- Page 149 and 150:
Powerful mobile device usage trends
- Page 151 and 152:
iPhone / Android Gaining Mobile Int
- Page 153 and 154:
Mobile Internet Operating System Co
- Page 155 and 156:
Handset Device Price / Volume Pyram
- Page 157 and 158:
High-End Quickly Becomes Low-End -
- Page 159 and 160:
iPhone 3G BOM = 33% Lower than iPho
- Page 161 and 162:
Apple iTunes App Revenue = Could Su
- Page 163 and 164:
Apple leads race for handset profit
- Page 165 and 166:
Apple + RIM = 13% Share of Handset
- Page 167 and 168:
Apple / RIM - Smartphone Leaders Co
- Page 169 and 170:
PC Platform Leaders (Microsoft + In
- Page 171 and 172:
Apple iPhone Base Case + Upside Cas
- Page 173 and 174:
Scenarios for Apple iPhone Market S
- Page 175 and 176:
The Apple Tablet Potential Should N
- Page 177 and 178:
Apple - Potential Long-Term Challen
- Page 179 and 180:
Google Android’s Open + Low Cost
- Page 181 and 182:
Apple may believe its platform mana
- Page 183 and 184:
In Technology, Products with Most /
- Page 185 and 186:
Multitudes of Android Phones - Tens
- Page 187 and 188:
Android’s Conundrum Open-Source S
- Page 189 and 190:
Next Generation Android Smartphones
- Page 191 and 192:
Apple’s Potential Long-Term Chall
- Page 193 and 194:
Native Apps Benefits Challenges For
- Page 195 and 196:
Native Apps Should Always Have Perf
- Page 197 and 198:
Apple = Likely Well Positioned to N
- Page 199 and 200:
Do Incumbents Have Apple-Like Poten
- Page 201 and 202:
Smartphones Not Relevant in Emergin
- Page 203 and 204:
Retail Sales (Not Carrier Sales) -
- Page 205 and 206:
Apple’s Success Has Been Proven i
- Page 207 and 208:
Buddhist Phone White-Box “Shanzha
- Page 209 and 210:
Don’t Expect Apple to Stand Still
- Page 211 and 212:
Carrier Exclusivity Limits Apple’
- Page 213 and 214:
iPhone Price Cut to $99 Would Elimi
- Page 215 and 216:
Ending Carrier Exclusivity = Could
- Page 217 and 218:
Battery Technology Constraining iPh
- Page 219 and 220:
Implications of New Horizontal Busi
- Page 221 and 222:
Apple’s Vertical Handset Model =
- Page 223 and 224:
Apple iPhone + iTouch = On Track to
- Page 225 and 226:
Apple iTouch - Key Companion to iPh
- Page 227 and 228:
RIM’s Vertical Handset Model = Pr
- Page 229 and 230:
Threats from RIM’s Vertical Integ
- Page 231 and 232:
Horizontal Handset Model Finally Em
- Page 233 and 234:
Opportunities / Benefits from Horiz
- Page 235 and 236:
Key Theme #4 235
- Page 237 and 238:
Key Theme #4 - Game-Changing Commun
- Page 239 and 240:
Facebook and Apple iPhone / iTouch
- Page 241 and 242:
Facebook + Apple iPhone / iTouch =
- Page 243 and 244:
Social Networks - Underpinning of I
- Page 245 and 246:
Social Networking Driving Consumer
- Page 247 and 248:
Social Networks - Gaining Material
- Page 249 and 250:
Facebook Platform - A Hub for Commu
- Page 251 and 252:
Facebook - Next Generation Portal f
- Page 253 and 254:
Facebook - Largest Share Gainer of
- Page 255 and 256:
Facebook / Twitter Replacing Tradit
- Page 257 and 258:
Communication on Twitter Not Only C
- Page 259 and 260:
Facebook Users = Heavy Content Crea
- Page 261 and 262:
Top 10 Facebook Applications - Game
- Page 263 and 264:
Facebook = A Platform for Advertise
- Page 265 and 266:
Facebook - Opportunity for Advertis
- Page 267 and 268:
Facebook - Advertiser / Vendor Succ
- Page 269 and 270:
Social Networks in General = Platfo
- Page 271 and 272:
LinkedIn - Social Network for Profe
- Page 273 and 274:
Like Twitter and Facebook, Foursqua
- Page 275 and 276:
Advertising Follows Eyeballs - Glob
- Page 277 and 278:
Facebook - Vibrant Developer / Appl
- Page 279 and 280:
Developer / Application Success on
- Page 281 and 282:
China Serves as Proxy & Leads World
- Page 283 and 284:
Tencent Business Model Overview - H
- Page 285 and 286:
Mobile = Future of Social Networks
- Page 287 and 288:
Mobile Social Networking in Japan ~
- Page 289 and 290:
Facebook Symbiotic with Mobile - Sh
- Page 291 and 292:
Carriers’ ‘Walled Gardens’ =
- Page 293 and 294:
Apple Unshackled Developers + Consu
- Page 295 and 296:
Mobile Commerce = Accelerator for O
- Page 297 and 298:
15 Years for Online to Reach 4% of
- Page 299 and 300:
Mobile Revolutionizing Commerce - W
- Page 301 and 302:
Deep Discounts - Invitation-Only Ti
- Page 303 and 304:
Traditional Retailers Using Pings t
- Page 305 and 306:
Key Theme #5 305
- Page 307 and 308:
Key Theme #5 Growth / Monetization
- Page 309 and 310:
Japan has led world by 5-10 years i
- Page 311 and 312:
ROW’s Mobile Internet Revenue Mix
- Page 313 and 314:
Mobile Revenue (ex. Data Access) pe
- Page 315 and 316:
3G Penetration - …Developed / Eme
- Page 317 and 318:
Why Has Japan Led the World in Mobi
- Page 319 and 320:
Rich Content / Apps / Services - Ja
- Page 321 and 322:
Powerful / Internet-Enabled Handset
- Page 323 and 324:
Japan Mobile Online Commerce / Paid
- Page 325 and 326:
Japan Mobile Online Commerce / Paid
- Page 327 and 328:
Japan as Proxy for Technology’s R
- Page 329 and 330:
Japan mobile monetization models pr
- Page 331 and 332:
Japan’s Mobile Online Commerce /
- Page 333 and 334:
Mobile Online Commerce - Promising
- Page 335 and 336:
Japan - Physical Products Gaining S
- Page 337 and 338:
ROW Also Making Inroads into Mobile
- Page 339 and 340:
ROW - Branded Mobile Apps Could Dri
- Page 341 and 342:
Digital Content (Music / Video / Ap
- Page 343 and 344:
Digital Content - Mobile Games / Mu
- Page 345 and 346:
Tencent Business Model Overview - H
- Page 347 and 348:
Japan - Virtual / Digital Goods on
- Page 349 and 350:
China Serves as Proxy & Leads World
- Page 351 and 352:
Developer / Application Success on
- Page 353 and 354:
Japan Mobile Paid Services 5 Years
- Page 355 and 356:
Rakuten Travel - Mobile Gross Hotel
- Page 357 and 358:
Mobile Advertising - Personalizatio
- Page 359 and 360:
Japan - Mobile Advertising - 24% CA
- Page 361 and 362:
Upside to Mobile Search Advertising
- Page 363 and 364:
Heavy Search / Display Advertising
- Page 365 and 366:
Interactive Video Advertising Revol
- Page 367 and 368:
Desktop Internet Monetization Evolu
- Page 369 and 370:
…While Premium Content Revenue (U
- Page 371 and 372:
At Margin, Advertising + Online Com
- Page 373 and 374:
Users Often Pay for Content as Long
- Page 375 and 376:
View of Paid vs. Ad-Supported Conte
- Page 377 and 378:
Media Time Spent vs. Ad Spend Out o
- Page 379 and 380:
History Proves That Ads Follow Eyeb
- Page 381 and 382:
Global Mobile Advertising Scenario
- Page 383 and 384:
Global Mobile Online Commerce / Pai
- Page 385 and 386:
Global Mobile Internet Ecosystem -
- Page 387 and 388:
Global Mobile Internet Ecosystem Re
- Page 389 and 390:
Mobile Internet Revenue Mix Shiftin
- Page 391 and 392:
Google - Internet Search Innovation
- Page 393 and 394:
Amazon.com - Online Shopping Experi
- Page 395 and 396:
Some companies can benefit from tec
- Page 397 and 398:
How Mobile Internet Revenue May Evo
- Page 399 and 400:
Key Theme #6 1) Wealth Creation / D
- Page 401 and 402:
Key Theme #6 - Massive Data Growth
- Page 403 and 404:
The Carriers’ Capex Conundrum…
- Page 405 and 406:
Massive Data Growth Driving Carrier
- Page 407 and 408:
Global Mobile Data Trends Imply Ong
- Page 409 and 410:
Global Mobile Data Users - 29% CAGR
- Page 411 and 412:
Global Mobile Data Users - 55% CAGR
- Page 413 and 414:
Company- and Product-level Mobile D
- Page 415 and 416:
AT&T = 50x Mobile Data Traffic Incr
- Page 417 and 418:
Data = Increasingly Dominating Netw
- Page 419 and 420:
European Market Supporting Data and
- Page 421 and 422:
Smartphone Data Usage Will Rise wit
- Page 423 and 424:
Near Term, Mobile Internet Usage Su
- Page 425 and 426:
European Mobile Network Utilization
- Page 427 and 428:
As Data Usage Becomes More Importan
- Page 429 and 430:
Aggregate Mobile Data Network Suppl
- Page 431 and 432:
Network Congestion in High Density
- Page 433 and 434:
Total Network Capacity on a Cell Si
- Page 435 and 436:
However, As Smartphone Penetration
- Page 437 and 438:
Overview of a Mobile Data Network T
- Page 439 and 440:
Wireless Capacity - Where Does It L
- Page 441 and 442:
Network Improvement Timeline Step A
- Page 443 and 444:
Short-Term Network Improvements - H
- Page 445 and 446: Short-term Network Improvements - W
- Page 447 and 448: Wireless Backhaul Capacity Expected
- Page 449 and 450: Mobile Internet Implications for Wi
- Page 451 and 452: Wi-Fi Moves from Carrier Foe to Fri
- Page 453 and 454: Wi-Fi Significantly Cheaper for Car
- Page 455 and 456: Wi-Fi Network Coverage in Home and
- Page 457 and 458: ~7,000 AT&T Wi-Fi Access Points at
- Page 459 and 460: Wi-Fi Case Study #2 - Boosting Valu
- Page 461 and 462: Bottom Line = Wi-Fi Offload Will Be
- Page 463 and 464: HSPA + Backhaul Upgrades Should Red
- Page 465 and 466: Long-term Network Improvements - Ne
- Page 467 and 468: Good News = Proprietary Network Opt
- Page 469 and 470: Long-term Network Improvements - Up
- Page 471 and 472: HSPA / LTE Buildout Roadmap - Succe
- Page 473 and 474: LTE = 24x Theoretical Bandwidth of
- Page 475 and 476: 39 Operators in 19 Countries Alread
- Page 477 and 478: LTE Introduction Cost Should Be Low
- Page 479 and 480: New Lower Spectrum Allocations, Suc
- Page 481 and 482: Spectral Efficiency ((Bit/S)/Hz), p
- Page 483 and 484: What effect will long-term network
- Page 485 and 486: Raw Network Capacity Improvement Ca
- Page 487 and 488: Underlying Technology Improvements
- Page 489 and 490: Case Study - 2010E Capex Analysis f
- Page 491 and 492: AT&T Plans to Increase Capacity in
- Page 493 and 494: Network Sharing Is Becoming Increas
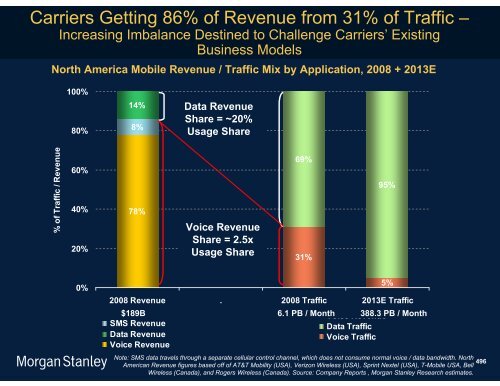
- Page 495: In the USA and W. Europe, Carrier V
- Page 499 and 500: Rapid Consumer / Business Adoption
- Page 501 and 502: VoIP International Long Distance (I
- Page 503 and 504: Mobile Texting Revenue Growth Slowi
- Page 505 and 506: Global Mobile Voice TTM Revenue of
- Page 507 and 508: Mobile Data Pricing Models in Flux
- Page 509 and 510: Flat-Rate Pricing = Necessary for U
- Page 511 and 512: Flat-Rate Wireless Data Plans - Pro
- Page 513 and 514: Flat-Rate Pricing May Also Encourag
- Page 515 and 516: Wireline Broadband Tiered Pricing C
- Page 517 and 518: KDDI Tiered Flat-Rate Pricing Cater
- Page 519 and 520: Bell Canada Combo Plans Bring Tiere
- Page 521 and 522: Base Case USA / W. Europe Carrier O
- Page 523 and 524: Key Scenario Drivers for US Wireles
- Page 525 and 526: USA Wireless Revenue Base Case Scen
- Page 527 and 528: Total ARPU Expected to Decline Slig
- Page 529 and 530: Non-Text Revenue = Key to Data Reve
- Page 531 and 532: W. Europe* Wireless Service Revenue
- Page 533 and 534: Implied W. Europe Wireless Carrier
- Page 535 and 536: Scale, Access to Spectrum and Capit
- Page 537 and 538: …10 Attributes of Winning Wireles
- Page 539 and 540: Scale = Key Competitive Advantage f
- Page 541 and 542: USA Spectrum Holdings - Larger Carr
- Page 543 and 544: Exclusive Devices (such as iPhone)
- Page 545 and 546: But Carrying the iPhone Is Mixed Bl
- Page 547 and 548:
Competitive Share Gain Opportunitie
- Page 549 and 550:
Scenario: AT&T Loses iPhone Exclusi
- Page 551 and 552:
Opportunities for Network Equipment
- Page 553 and 554:
Total Wireless Equipment Revenue Ex
- Page 555 and 556:
Network Services Is Now ~$80B Addre
- Page 557 and 558:
Mobile / 3G Subscriber Trends by Co
- Page 559 and 560:
…Mobile / 3G Subscriber Trends by
- Page 561 and 562:
…Mobile / 3G Subscriber Trends by
- Page 563 and 564:
Key Theme #7 563
- Page 565 and 566:
Key Theme #7 - Compelling Opportuni
- Page 567 and 568:
Emerging Markets = Significant Long
- Page 569 and 570:
Emerging Markets = Significant Long
- Page 571 and 572:
At Inflection Point, Long-Term EM O
- Page 573 and 574:
Opportunities Could Be Significant
- Page 575 and 576:
Over Time, Impact of Mobile Interne
- Page 577 and 578:
…Caused in Part by Sub-20% Fixed-
- Page 579 and 580:
3G / Wireless = ‘Only Choice’ f
- Page 581 and 582:
Vibrant Mobile Value-Added Services
- Page 583 and 584:
Emerging Asia VAS Revenue Share Alr
- Page 585 and 586:
Emerging Market Carriers Adapted to
- Page 587 and 588:
Bharti-Airtel = Cost Savings from O
- Page 589 and 590:
Compressing Wireless Data Could Red
- Page 591 and 592:
Emerging Markets - Some Near-Term 3
- Page 593 and 594:
Near-Term 3G Adoption Barriers = Lo
- Page 595 and 596:
Low Post-Paid Ratio + Low GDP per C
- Page 597 and 598:
High Monthly Data Plan Costs = Near
- Page 599 and 600:
Emerging Markets Regional Analysis
- Page 601 and 602:
Regional Analysis / Forecast - Chin
- Page 603 and 604:
Chinese Consumers Are Ready for 3G
- Page 605 and 606:
3G Creates New Battle Ground for Ch
- Page 607 and 608:
iPhone Costs Too High for Majority
- Page 609 and 610:
Key Scenario Drivers for China Wire
- Page 611 and 612:
China Wireless Revenue Base Case Sc
- Page 613 and 614:
Data ARPU Growth Expected to Partia
- Page 615 and 616:
India - Near-term Barriers to 3G Ad
- Page 617 and 618:
India - Upcoming Auction to Bring 3
- Page 619 and 620:
Base Case: Winning 3G Spectrum Does
- Page 621 and 622:
Capex Required for 3G Network Could
- Page 623 and 624:
Other Emerging Asia - Low Fixed-Lin
- Page 625 and 626:
Philippines - Mobile Overtook Fixed
- Page 627 and 628:
Indonesia - Mobile Could Accelerate
- Page 629 and 630:
WiMAX in Emerging Asia - Still in N
- Page 631 and 632:
EEMEA - Carriers Leverage Cost-Effe
- Page 633 and 634:
Africa - Mobile Broadband Prolifera
- Page 635 and 636:
Middle East + Africa Have the Lowes
- Page 637 and 638:
Key Scenario Drivers for Russia Wir
- Page 639 and 640:
Key Theme #8 639
- Page 641 and 642:
Key Theme #8 - Regulators Can Help
- Page 643 and 644:
Net Neutrality - Key to Decentraliz
- Page 645 and 646:
In the US, FCC Has Issued a “Noti
- Page 647 and 648:
Both Sides of Net Neutrality Debate
- Page 649 and 650:
What Could Regulators Do to Acceler
- Page 651 and 652:
Lower Mobile Data Roaming Fees = En
- Page 653 and 654:
“Not in My Back Yard” (NIMBY) P
- Page 655 and 656:
3G Licenses Reshape China’s Compe
- Page 657 and 658:
USA Recent Developments - USA F
- Page 659 and 660:
Recent Developments - China / India
- Page 661 and 662:
Disclosure Section (cont.) Morgan S
- Page 663 and 664:
Disclosure Section (cont.) Within t
- Page 665 and 666:
Disclosure Section (cont.) Analyst
- Page 667 and 668:
Disclosure Section (cont.) Stock Pr
- Page 669 and 670:
Disclosure Section (cont.) Importan
- Page 671:
Disclosure Section (cont.) MTN does