- Page 1 and 2:
Management of Technology and Innova
- Page 3 and 4:
Prof. Dr. Cornelius Herstatt Christ
- Page 5 and 6:
VI Preface and Introduction its ori
- Page 7 and 8:
VIII Preface and Introduction commo
- Page 9 and 10:
X Preface and Introduction no longe
- Page 11 and 12:
XII Preface and Introduction Based
- Page 13 and 14:
XIV Preface and Introduction ��
- Page 15 and 16:
XVI Preface and Introduction 60�
- Page 17 and 18:
Table of Contents Part I: Strategic
- Page 19 and 20:
List of Contributing Authors Yaichi
- Page 21 and 22:
List of Contributing Authors XXIII
- Page 23 and 24:
Designing the Product Architecture
- Page 25 and 26:
Designing the Product Architecture
- Page 27 and 28:
Designing the Product Architecture
- Page 29 and 30:
Designing the Product Architecture
- Page 31 and 32:
Designing the Product Architecture
- Page 33 and 34:
Designing the Product Architecture
- Page 35 and 36:
Designing the Product Architecture
- Page 37 and 38:
Designing the Product Architecture
- Page 39 and 40:
Designing the Product Architecture
- Page 41 and 42:
Designing the Product Architecture
- Page 43 and 44:
Designing the Product Architecture
- Page 45 and 46:
Designing the Product Architecture
- Page 47 and 48:
Designing the Product Architecture
- Page 49 and 50:
30 A. Takeishi and Y. Aoshima “gr
- Page 51 and 52:
32 A. Takeishi and Y. Aoshima The B
- Page 53 and 54:
34 A. Takeishi and Y. Aoshima troub
- Page 55 and 56:
36 A. Takeishi and Y. Aoshima Histo
- Page 57 and 58:
38 A. Takeishi and Y. Aoshima bles
- Page 59 and 60:
40 A. Takeishi and Y. Aoshima mud,
- Page 61 and 62:
42 A. Takeishi and Y. Aoshima Table
- Page 63 and 64:
44 A. Takeishi and Y. Aoshima Shima
- Page 65 and 66:
46 A. Takeishi and Y. Aoshima of th
- Page 67 and 68:
48 A. Takeishi and Y. Aoshima parts
- Page 69 and 70:
50 K. Kusunoki anticipating and sol
- Page 71 and 72:
52 K. Kusunoki both manufacturers a
- Page 73 and 74:
54 K. Kusunoki users. With the rele
- Page 75 and 76:
56 K. Kusunoki existing performance
- Page 77 and 78:
58 K. Kusunoki the LCD computer mon
- Page 79 and 80:
60 K. Kusunoki In the home-use vide
- Page 81 and 82:
62 K. Kusunoki systems with interna
- Page 83 and 84:
64 K. Kusunoki visible dimensions e
- Page 85 and 86:
66 K. Kusunoki Cocoon appears a goo
- Page 87 and 88:
68 K. Kusunoki level system. To acq
- Page 89 and 90:
70 K. Kusunoki music editing softwa
- Page 91 and 92:
The Customer System and New Product
- Page 93 and 94:
The Customer System and New Product
- Page 95 and 96:
The Customer System and New Product
- Page 97 and 98:
The Customer System and New Product
- Page 99 and 100:
The Customer System and New Product
- Page 101 and 102:
The Customer System and New Product
- Page 103 and 104:
Part II: Process Aspects
- Page 105 and 106:
88 S. J. Harryson An important sugg
- Page 107 and 108:
90 S. J. Harryson Introducing a Kno
- Page 109 and 110:
92 S. J. Harryson Their data also s
- Page 111 and 112:
94 S. J. Harryson view of transacti
- Page 113 and 114:
96 S. J. Harryson but never produce
- Page 115 and 116:
98 S. J. Harryson Know-Who in Produ
- Page 117 and 118:
100 S. J. Harryson Leveraging Intra
- Page 119 and 120:
102 S. J. Harryson naka stated that
- Page 121 and 122:
104 S. J. Harryson protect Canon’
- Page 123 and 124:
106 S. J. Harryson Consequently, a
- Page 125 and 126:
108 S. J. Harryson References Abegg
- Page 127 and 128:
110 S. J. Harryson Johansson U and
- Page 129 and 130:
The Domestic Shaping of Japanese In
- Page 131 and 132:
The Domestic Shaping of Japanese In
- Page 133 and 134:
The Domestic Shaping of Japanese In
- Page 135 and 136:
The Domestic Shaping of Japanese In
- Page 137 and 138:
The Domestic Shaping of Japanese In
- Page 139 and 140:
The Domestic Shaping of Japanese In
- Page 141 and 142:
The Domestic Shaping of Japanese In
- Page 143 and 144:
The Domestic Shaping of Japanese In
- Page 145 and 146:
The Domestic Shaping of Japanese In
- Page 147 and 148:
The Domestic Shaping of Japanese In
- Page 149 and 150:
The Domestic Shaping of Japanese In
- Page 151 and 152:
The Domestic Shaping of Japanese In
- Page 153 and 154:
Fig. 3. Japanese creativity with lo
- Page 155 and 156:
The Domestic Shaping of Japanese In
- Page 157 and 158:
The Domestic Shaping of Japanese In
- Page 159 and 160:
144 M. Yasumoto and T. Fujimoto low
- Page 161 and 162:
146 M. Yasumoto and T. Fujimoto in
- Page 163 and 164:
148 M. Yasumoto and T. Fujimoto sup
- Page 165 and 166:
150 M. Yasumoto and T. Fujimoto Mea
- Page 167 and 168:
152 M. Yasumoto and T. Fujimoto com
- Page 169 and 170:
154 M. Yasumoto and T. Fujimoto Jap
- Page 171 and 172:
156 M. Yasumoto and T. Fujimoto The
- Page 173 and 174:
158 M. Yasumoto and T. Fujimoto As
- Page 175 and 176:
160 M. Yasumoto and T. Fujimoto The
- Page 177 and 178:
162 M. Yasumoto and T. Fujimoto The
- Page 179 and 180:
164 M. Yasumoto and T. Fujimoto Bru
- Page 181 and 182:
“Fuzzy Front End” Practices in
- Page 183 and 184:
Number of companies 250 200 150 100
- Page 185 and 186:
“Fuzzy Front End” Practices in
- Page 187 and 188:
“Fuzzy Front End” Practices in
- Page 189 and 190:
N=551 “Fuzzy Front End” Practic
- Page 191 and 192:
“Fuzzy Front End” Practices in
- Page 193 and 194:
“Fuzzy Front End” Practices in
- Page 195 and 196:
“Fuzzy Front End” Practices in
- Page 197 and 198:
“Fuzzy Front End” Practices in
- Page 199 and 200:
186 R. Haak The Toyota production s
- Page 201 and 202:
188 R. Haak (1988, p. 3) pointed ou
- Page 203 and 204:
190 R. Haak Essentially, the key fa
- Page 205 and 206:
192 R. Haak movement of materials n
- Page 207 and 208:
194 R. Haak ent from traditional me
- Page 209 and 210:
196 R. Haak Total Quality Control (
- Page 211 and 212:
198 R. Haak or shared with other co
- Page 213 and 214:
200 R. Haak Görgens J (1994) Just
- Page 215 and 216:
202 R. Haak Ohno T (1988) Toyota Pr
- Page 217 and 218:
Part III: Organizational Aspects
- Page 219 and 220:
208 K. Nobeoka Firms such as Toyota
- Page 221 and 222:
210 K. Nobeoka to share technology
- Page 223 and 224:
212 K. Nobeoka launched an initiati
- Page 225 and 226:
214 K. Nobeoka only 23 departments
- Page 227 and 228:
216 K. Nobeoka product introduction
- Page 229 and 230:
218 K. Nobeoka 1993. Rather the cha
- Page 231 and 232:
220 K. Nobeoka Second, Toyota also
- Page 233 and 234:
222 K. Nobeoka and it was not often
- Page 235 and 236:
224 K. Nobeoka The hierarchical chi
- Page 237 and 238:
226 K. Nobeoka tion. Engineers can
- Page 239 and 240:
228 K. Nobeoka believes that five d
- Page 241 and 242:
230 K. Nobeoka Discussion and Concl
- Page 243 and 244:
232 K. Nobeoka essential to support
- Page 245 and 246:
234 K. Nobeoka Markides C and Willi
- Page 247 and 248:
236 D. Ge and T. Fujimoto ownership
- Page 249 and 250:
238 D. Ge and T. Fujimoto shares th
- Page 251 and 252:
240 D. Ge and T. Fujimoto Table 1.
- Page 253 and 254:
242 D. Ge and T. Fujimoto Based on
- Page 255 and 256:
244 D. Ge and T. Fujimoto Discussio
- Page 257 and 258:
246 D. Ge and T. Fujimoto sourcing
- Page 259 and 260:
248 D. Ge and T. Fujimoto Nishiguch
- Page 261 and 262:
250 C. Herstatt, C. Stockstrom, and
- Page 263 and 264: 252 C. Herstatt, C. Stockstrom, and
- Page 265 and 266: 254 C. Herstatt, C. Stockstrom, and
- Page 267 and 268: 256 C. Herstatt, C. Stockstrom, and
- Page 269 and 270: 258 C. Herstatt, C. Stockstrom, and
- Page 271 and 272: 260 C. Herstatt, C. Stockstrom, and
- Page 273 and 274: 262 C. Herstatt, C. Stockstrom, and
- Page 275 and 276: 264 C. Herstatt, C. Stockstrom, and
- Page 277 and 278: Part IV: Cultural Aspects
- Page 279 and 280: 270 C. Nakata and S. Im have not be
- Page 281 and 282: 272 C. Nakata and S. Im ucts, such
- Page 283 and 284: 274 C. Nakata and S. Im customers a
- Page 285 and 286: 276 C. Nakata and S. Im New Product
- Page 287 and 288: 278 C. Nakata and S. Im Measures We
- Page 289 and 290: 280 C. Nakata and S. Im analysis in
- Page 291 and 292: 282 C. Nakata and S. Im Managerial
- Page 293 and 294: 284 C. Nakata and S. Im derstanding
- Page 295 and 296: 286 C. Nakata and S. Im Fukuyama F
- Page 297 and 298: Differences in the Internationaliza
- Page 299 and 300: Differences in the Internationaliza
- Page 301 and 302: Differences in the Internationaliza
- Page 303 and 304: Differences in the Internationaliza
- Page 305 and 306: Differences in the Internationaliza
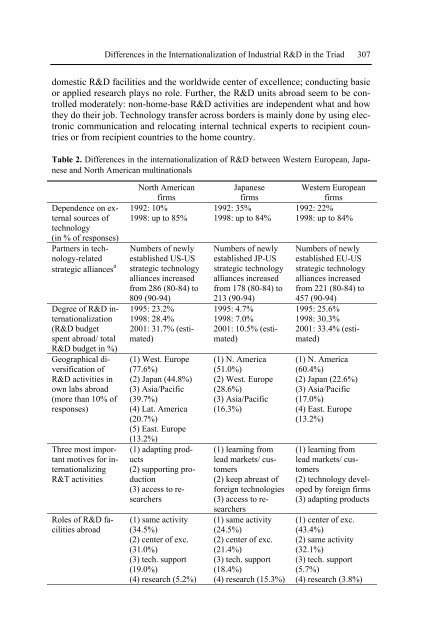
- Page 307 and 308: Differences in the Internationaliza
- Page 309 and 310: Differences in the Internationaliza
- Page 311 and 312: 3.94 To adapt products to local req
- Page 313: Differences in the Internationaliza
- Page 317 and 318: Acknowledgment Differences in the I
- Page 319 and 320: Global Innovation and Knowledge Flo
- Page 321 and 322: Global Innovation and Knowledge Flo
- Page 323 and 324: Global Innovation and Knowledge Flo
- Page 325 and 326: Global Innovation and Knowledge Flo
- Page 327 and 328: Global Innovation and Knowledge Flo
- Page 329 and 330: Global Innovation and Knowledge Flo
- Page 331 and 332: Global Innovation and Knowledge Flo
- Page 333 and 334: Global Innovation and Knowledge Flo
- Page 335 and 336: Global Innovation and Knowledge Flo
- Page 337 and 338: 330 C. Herstatt, B. Verworn, and A.
- Page 339 and 340: 332 C. Herstatt, B. Verworn, and A.
- Page 341 and 342: 334 C. Herstatt, B. Verworn, and A.
- Page 343 and 344: 336 C. Herstatt, B. Verworn, and A.
- Page 345 and 346: 338 C. Herstatt, B. Verworn, and A.
- Page 347 and 348: 340 C. Herstatt, B. Verworn, and A.
- Page 349 and 350: 342 C. Herstatt, B. Verworn, and A.
- Page 351 and 352: 344 C. Herstatt, B. Verworn, and A.
- Page 353 and 354: 346 C. Herstatt, B. Verworn, and A.
- Page 355 and 356: 348 C. Herstatt, B. Verworn, and A.
- Page 357 and 358: 350 C. Herstatt, B. Verworn, and A.
- Page 359 and 360: 352 C. Herstatt, B. Verworn, and A.
- Page 361 and 362: From Practice: IP Management in Jap
- Page 363 and 364: From Practice: IP Management in Jap
- Page 365 and 366:
From Practice: IP Management in Jap
- Page 367 and 368:
Objectives of IP management To cont
- Page 369 and 370:
From Practice: IP Management in Jap
- Page 371 and 372:
From Practice: IP Management in Jap
- Page 373 and 374:
From Practice: IP Management in Jap
- Page 375 and 376:
From Practice: IP Management in Jap
- Page 377 and 378:
From Practice: IP Management in Jap
- Page 379 and 380:
From Practice: IP Management in Jap
- Page 381 and 382:
From Practice: IP Management in Jap
- Page 383 and 384:
From Practice: IP Management in Jap
- Page 385 and 386:
Technology Planning Function From P
- Page 387 and 388:
From Practice: IP Management in Jap
- Page 389 and 390:
From Practice: IP Management in Jap
- Page 391 and 392:
MoT: From Academia to Management Pr
- Page 393 and 394:
MoT: From Academia to Management Pr
- Page 395 and 396:
MoT: From Academia to Management Pr
- Page 397 and 398:
MoT: From Academia to Management Pr
- Page 399 and 400:
MoT: From Academia to Management Pr
- Page 401 and 402:
MoT: From Academia to Management Pr
- Page 403 and 404:
MoT: From Academia to Management Pr
- Page 405 and 406:
MoT: From Academia to Management Pr
- Page 407 and 408:
MoT: From Academia to Management Pr
- Page 409 and 410:
Index 3G 148 f., 152 5 S process 19
- Page 411 and 412:
Japanese consumers 125, 129, 135 Ja