- Page 1 and 2:
eSafety CompendiumMay 2006
- Page 4:
Table of ContentsINTRODUCTION .....
- Page 7 and 8:
Page 5 of 490
- Page 9 and 10:
Modern society depends heavily on m
- Page 11 and 12:
This eSafety Compendium aims to sum
- Page 13 and 14:
The Forum Plenary Sessions discuss
- Page 15 and 16:
IntroductionThe eSafety High-Level
- Page 17 and 18:
· NL - Ministry of Transport, Publ
- Page 19 and 20:
Further improvements in safety by t
- Page 21 and 22:
The driver is also aware that his c
- Page 23 and 24:
For both cars and commercial vehicl
- Page 25:
It can be expected that in the near
- Page 28 and 29:
Their market introduction is, howev
- Page 30 and 31:
Ongoing activities aimed at providi
- Page 32 and 33:
Lane supportThese systems decrease
- Page 34 and 35:
Most promising for the mitigation o
- Page 36 and 37:
Considering these current market si
- Page 38 and 39:
Commercial in-vehicle e-Call system
- Page 40 and 41:
Public-private partnerships would b
- Page 42 and 43:
ETSI, the European Telecommunicatio
- Page 44 and 45:
Multi-Media productsThe available a
- Page 46 and 47:
Towards a European Code of Practise
- Page 48 and 49:
Recommendations:(23) Estimate the s
- Page 50 and 51:
Special case: The e-Call business m
- Page 52 and 53:
Glossary of Abbreviations and Acron
- Page 54 and 55:
Final Report of the eSafety Working
- Page 56 and 57:
9 Identify existing specifications,
- Page 58 and 59:
17 Support the wider use of the pan
- Page 60 and 61:
26 Support the e-Call business mode
- Page 62 and 63:
The Working Group on Research and D
- Page 64 and 65:
Accident Causation DataRecommendati
- Page 66 and 67:
Future actions:The Working Group on
- Page 68 and 69:
A survey on “Incentives schemes a
- Page 70 and 71:
Human-Machine InteractionRecommenda
- Page 72 and 73:
Member States should:• Take measu
- Page 74 and 75:
eSafety Working Groups:The Road Map
- Page 76 and 77:
d. EuroNCAP should incorporate such
- Page 78 and 79:
Intelligent Integrated Road Safety
- Page 80 and 81:
Recommendation number and title:9)
- Page 82 and 83:
Recommendation number and title:10)
- Page 84 and 85:
The European Safety Map databaseRec
- Page 86 and 87:
eSafety Working Groups:The Digital
- Page 88 and 89:
One of the tasks within the GST Res
- Page 90 and 91:
Real-time Traffic and Traveller Inf
- Page 92 and 93:
eSafety Working Groups:The RTTI Wor
- Page 94 and 95:
Safety systems standards and regula
- Page 96 and 97:
• An agreement on these developme
- Page 98 and 99:
European R&D:(not available)Nationa
- Page 100 and 101:
The socio-economic impact was preli
- Page 102 and 103:
Recommendation number and title:24)
- Page 104 and 105:
Recommendation number and title:26)
- Page 106 and 107:
User OutreachRecommendation number
- Page 108 and 109:
The eSafety ForumRecommendation num
- Page 110:
ConclusionSince the launch of the e
- Page 114 and 115:
On the basis of the report of the e
- Page 116 and 117:
IntroductionSeveral eSafety High Le
- Page 118 and 119:
Creating a positive business case a
- Page 120 and 121:
3.2 Second eSafety High Level Meeti
- Page 122 and 123:
Role of the eSafety ForumThe eSafet
- Page 124 and 125:
3.3.2 General ConclusionsThe first
- Page 126 and 127:
HMIThe scope of the work of the HMI
- Page 128 and 129:
HMIHuman-Machine Interaction presen
- Page 130 and 131:
1.2 The Commission CommunicationBas
- Page 132 and 133:
Human-Machine InteractionHuman-Mach
- Page 134 and 135:
1.4 eScope: The eSafety Observatory
- Page 136 and 137:
• stakeholders can then share and
- Page 138 and 139:
o Transporting the eCall data and v
- Page 140 and 141:
2.3 Human-Machine Interaction WGCo-
- Page 142 and 143:
Development of a detailed workplanF
- Page 144 and 145:
18 Regulation Yes Yes Yes See the W
- Page 146 and 147:
• Limited motivation of some broa
- Page 148 and 149:
• If possible, find some viable o
- Page 150 and 151:
R&D focus)Road Infrastructure:• S
- Page 152 and 153:
These items are combined into a eSa
- Page 154 and 155:
ANNEX I: Members of the eSafety For
- Page 156 and 157:
International Co-operation WGMartin
- Page 158 and 159:
ANNEX II: Terms of Reference of the
- Page 160 and 161:
4.4 The Working Groups will also pr
- Page 162 and 163:
3.6 Third eSafety Forum PlenaryMeet
- Page 164 and 165:
• EU wide assessment and verifica
- Page 166 and 167:
3.7 eSafety High-Level Meeting with
- Page 168 and 169:
Recommended Actions for the Member
- Page 170 and 171:
Human-Machine Interaction (HMI)With
- Page 172 and 173:
3.8 eSafety High Level Meeting with
- Page 174 and 175:
A positive business case for eCall,
- Page 176 and 177:
Recommendations of the eCall Drivin
- Page 178 and 179:
User OutreachThe User Outreach WG s
- Page 180:
The In-Vehicle Emergency Call (eCal
- Page 183 and 184:
IntroductionThe Working Groups are
- Page 185 and 186:
4.1.1 Final Report and Recommendati
- Page 187 and 188:
Next stepsThe work to carry out the
- Page 189 and 190:
FULFILMENT OF OBJECTIVES 481. Quali
- Page 191 and 192:
3. Evaluation• Many methodologies
- Page 193 and 194:
2. The needs2.1 DiagnosisParameter
- Page 195 and 196:
Parameter Generic Question Detailed
- Page 197 and 198:
3.2 Prospective angle• Predict tr
- Page 199 and 200:
The working group currently has mem
- Page 201 and 202:
4.2 Communications Working GroupDur
- Page 203 and 204:
4.3 Digital Maps Working GroupDiscu
- Page 205 and 206:
4.3.1 Digital Maps Working Group Fi
- Page 207 and 208:
The organisation of the Working Gro
- Page 209 and 210:
Intersection Assistance: Informs th
- Page 211 and 212:
Hotspot Warning Accident hot spots
- Page 213 and 214:
In the second phase the necessary i
- Page 215 and 216:
4.2.2 RelationshipThe INSPIRE Direc
- Page 217 and 218:
4.4.2 RelationshipSpeed limit infor
- Page 219 and 220:
Conclusions: It was agreed by the W
- Page 221 and 222:
5. A specification of the following
- Page 223 and 224:
Table5 - Shortlist of requirements
- Page 225 and 226:
4.4 eCall Driving GroupDiscussions
- Page 227 and 228:
4.4.1 Memorandum of Understanding f
- Page 229 and 230:
2.4 Vehicle ManufacturersVehicle Ma
- Page 231 and 232:
SIGNATURE PAGESRepresentative from(
- Page 233 and 234:
4.4.2 eCall Memorandum of Understan
- Page 235 and 236:
The Heavy Duty Vehicles Working Gro
- Page 237 and 238:
The group analyzed the introduction
- Page 239 and 240:
Our efforts to secure active partic
- Page 241 and 242:
The workshop on the incidence of ac
- Page 243 and 244:
All scores are to be taken as estim
- Page 245 and 246:
Previously, these statistics simply
- Page 247 and 248:
Examples of published results from
- Page 249 and 250:
1Truck singleDriving off roadS E D
- Page 251 and 252:
In the analyses of Volvo and IVECO
- Page 253 and 254:
There are also some significant lev
- Page 255 and 256:
The operating principle of ESP is n
- Page 257 and 258:
3,75 m3,75 m0 100 mFig 5: Adaptive
- Page 259 and 260:
The Working Group decided against t
- Page 261 and 262:
5.3.6 Infrastructure-supported inte
- Page 263 and 264:
The Group has also assessed the ava
- Page 265 and 266:
All the substantive development wor
- Page 267 and 268:
Most of the systems examined here w
- Page 269 and 270:
6.2 Legal constraintsIn an age in w
- Page 271 and 272:
Intersection assistantInter-vehicle
- Page 273 and 274:
Appendix [1] - RecommendationsRecom
- Page 275 and 276:
Appendix [2] - Extract from scoring
- Page 277 and 278:
4.6 Human-Machine InteractionWorkin
- Page 279 and 280:
4.6.1 Recommendations from the eSaf
- Page 281 and 282:
More specifically the WG recommends
- Page 283 and 284:
The recommendations were presented
- Page 285 and 286:
1.2 Member States´ responses 58Fol
- Page 287 and 288:
Thus, it can be regarded as hardly
- Page 289 and 290:
ADAM - Advanced Driver Attention Me
- Page 291 and 292:
The ESoP on HMI clearly covers all
- Page 293 and 294:
The driver may have limited knowled
- Page 295 and 296:
Example:the box “nomadic system x
- Page 297 and 298:
The current version of the ESoP alr
- Page 299 and 300: 5. Recommendations on a revised Eur
- Page 301 and 302: As a result of this challenge, the
- Page 303 and 304: Annex F tabulates a comparison of t
- Page 305 and 306: 6.1.2 RecommendationsR-SyM-1R-SyM-2
- Page 307 and 308: European Health and Safety Directiv
- Page 309 and 310: Monitoring and Enforcement 78R-MS-5
- Page 311 and 312: Service ProvidersR-SP-1 Service pro
- Page 313 and 314: ANNEX AComposition of WG-HMIThe Wor
- Page 315 and 316: EU Statement of Principles2.5 Visua
- Page 317 and 318: 4.4 System controls should be desig
- Page 319 and 320: Section 6.0 Principles on Informati
- Page 321 and 322: German car manufacturers and suppli
- Page 323 and 324: European Health and Safety Directiv
- Page 325 and 326: 3. Information Presentation Princip
- Page 327 and 328: 5. System Behaviour PrinciplesEU St
- Page 329 and 330: ANNEX FESoP - Draft Japanese Guidel
- Page 331 and 332: 4. Principles on Interaction with D
- Page 333 and 334: 6.3 System instructions should be i
- Page 335 and 336: Elaboration:Aftermarket IVIS in thi
- Page 337 and 338: The first test should be carried ou
- Page 339 and 340: 4.7 Implementation Road MapsWorking
- Page 341 and 342: 4.7.1 Final Report and Recommendati
- Page 343 and 344: The following recommendations were
- Page 345 and 346: The Implementation Road Map WG was
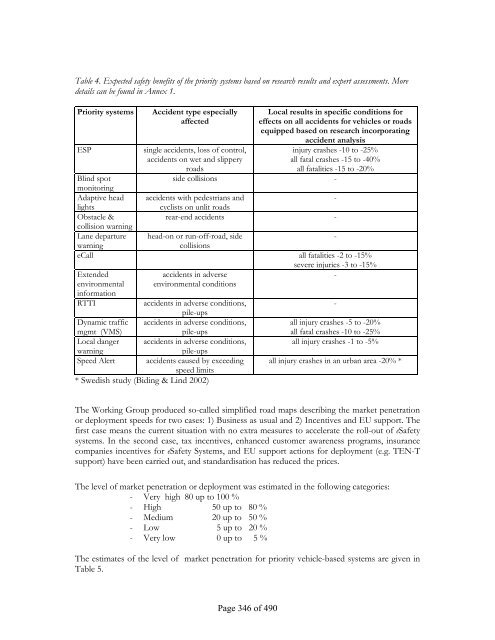
- Page 347 and 348: Table 1. Description of vehicle bas
- Page 349: Table 3. Technology prerequisites f
- Page 353 and 354: Implementation support% new cars eq
- Page 355 and 356: 7.1 ESPThe general key success fact
- Page 357 and 358: For most eSafety related functions
- Page 359 and 360: floating car data system. An organi
- Page 361 and 362: ased systems for producing the nece
- Page 363 and 364: 8. Updating of implementation road
- Page 365 and 366: In addition to the Implementation R
- Page 367 and 368: i. The European Commission should s
- Page 369 and 370: Another U.S. study (Farmer 2004) co
- Page 371 and 372: eCallConsidering the safety benefit
- Page 373 and 374: Influencing vehicle speeds with the
- Page 375 and 376: E-MERGE (2004). E-MERGE Compiled Ev
- Page 377 and 378: Wakasugi, T. &Yamada, K. (2000). Dr
- Page 379 and 380: AdaptiveBrake LightsExtendedenviron
- Page 381 and 382: Page 376 of 490
- Page 383 and 384: The most efficient ITS applications
- Page 385 and 386: Annex 2: Deployment of ITS on the T
- Page 387 and 388: Annex 3: Descriptions of implementa
- Page 389 and 390: satisfactory manner. Information ca
- Page 391 and 392: technical availability: givenImprov
- Page 393 and 394: Implementation Issues for Adaptive
- Page 395 and 396: Adaptive HeadlightsVery highHighMed
- Page 397 and 398: technical availability: given(radar
- Page 399 and 400: Implementation Issues for Lane Depa
- Page 401 and 402:
Road fatalities in EU25 Accident an
- Page 403 and 404:
C Road and Information Infrastructu
- Page 405 and 406:
o Finalize infrastructure in all ot
- Page 407 and 408:
Organisation for Standardisation in
- Page 409 and 410:
With the help of these measures, th
- Page 411 and 412:
- the limited capacity in FM which
- Page 413 and 414:
HFeasible Deployment Strategiestech
- Page 415 and 416:
Implementation Issues for Dynamic T
- Page 417 and 418:
different national and even local a
- Page 419 and 420:
o The safety benefits of all new ty
- Page 421 and 422:
Implementation Issues for Speed Ale
- Page 423 and 424:
o In order to deploy an autonomous
- Page 425 and 426:
Annex 4: Terms of Reference for the
- Page 427 and 428:
Annex 5: Members of the Implementat
- Page 429 and 430:
4.9 Real-time Traffic and Travel In
- Page 431 and 432:
So, RDS/TMC offers at the time bein
- Page 433 and 434:
Additionally, the eSafety Forum had
- Page 435 and 436:
4. Running Activities and the Inter
- Page 437 and 438:
The expected answers may not be ver
- Page 439 and 440:
6. Steps ahead in the very near Fut
- Page 441 and 442:
4.10 Research and DevelopmentWorkin
- Page 443 and 444:
*Passive safety is not strictly con
- Page 445 and 446:
The project GST aims at creating a
- Page 447 and 448:
• Use of potential opportunities
- Page 449:
4.11 User Outreach Working GroupThe
- Page 452 and 453:
5.1 E112112 is the single emergency
- Page 454 and 455:
The introduction of such active saf
- Page 456 and 457:
- lower vehicle operating costs- mo
- Page 458 and 459:
Services already exist in Europe ba
- Page 460 and 461:
- The vehicles in the Co-Operative
- Page 462 and 463:
why the eSafety Forum Communication
- Page 464 and 465:
5.6 National ActivitiesFleetNet - I
- Page 466 and 467:
6.3 International Workshop on Vehic
- Page 468:
What should be done?Europe, as the
- Page 471 and 472:
6.1 Acronym list3GT: 3rd Generation
- Page 473 and 474:
CLI: Caller Line IdentificationCMV:
- Page 475 and 476:
FVD: Floating Vehicle data (see als
- Page 477 and 478:
MoU: Memorandum of UnderstandingMSC
- Page 479 and 480:
TEN: Trans-European NetworkTEN-T: T
- Page 481 and 482:
6.2 eSafety Glossary112:The Pan-Eur
- Page 483 and 484:
Work is ongoing to refine the ANB d
- Page 485 and 486:
DARC (Data Radio Channel):A digital
- Page 487 and 488:
EMC (ElectroMagnetic Compatibility)
- Page 489 and 490:
GST (Global System for Telematics I
- Page 491 and 492:
LBS (Location-Based Services):Servi
- Page 493 and 494:
Roll Stability Control system (RSC)
- Page 495:
VMS (Variable Message Signs):Roadsi
- Page 499 and 500:
ANNEX I - 1ST ESAFETYCOMMUNICATION:
- Page 501 and 502:
COMMUNICATION FROM THE COMMISSIONTO
- Page 503 and 504:
TABLE OF CONTENTSPREFACE...........
- Page 505 and 506:
1.3. Urgent actions required in mee
- Page 507 and 508:
efficiency and reduction of equipme
- Page 509 and 510:
The EU has played a role in this re
- Page 511 and 512:
improved vision, driver monitoring
- Page 513 and 514:
3. RATIONALE FOR COMMUNITY ACTIONS3
- Page 515 and 516:
• Establish national liaison grou
- Page 517 and 518:
aimed at accelerating the deploymen
- Page 519 and 520:
Furthermore, the Commission encoura
- Page 521 and 522:
4.3. Removing the societal and busi
- Page 523 and 524:
5. REPORTINGMonitoring of the progr
- Page 525 and 526:
GDPGPSGPRSGSMHMIICTISOISTITSNHTSAPS
- Page 527:
have welcomed the eSafety Initiativ
- Page 530 and 531:
COMMISSION OF THE EUROPEAN COMMUNIT
- Page 532 and 533:
In case of an accident, the eCall d
- Page 534 and 535:
PSAP, and adding the costs for trai
- Page 536 and 537:
Figure 2: Road Map for eCall roll-o
- Page 538 and 539:
eCall has to operate in all GSM and
- Page 541 and 542:
ANNEX III - 3RD ESAFETYCOMMUNICATIO
- Page 543 and 544:
1. PURPOSE AND SCOPE OF THIS COMMUN
- Page 545 and 546:
What is the potential of these inte
- Page 547 and 548:
(1) Coordinate and support the work
- Page 549 and 550:
Under FP6 a first group of projects
- Page 551:
6. CONCLUSIONSThe present Communica
- Page 554 and 555:
Radio SpectrumPolicy22Unleashing Eu
- Page 557 and 558:
ANNEX V - DECISION ONA REGULATORYFR
- Page 559 and 560:
L 108/2 24.4.2002Official Journal o
- Page 561 and 562:
L 108/4 24.4.2002Official Journal o
- Page 563:
L 108/6 24.4.2002Official Journal o
- Page 566 and 567:
EN25.1.2005 Official Journal of the
- Page 568 and 569:
EN25.1.2005 Official Journal of the
- Page 570 and 571:
EN25.1.2005 Official Journal of the
- Page 573 and 574:
ANNEX VII - MANDATETO CEPT TO HARMO
- Page 575 and 576:
MANDATE TO CEPT TO HARMONISE RADIO
- Page 577 and 578:
Given the mobility within and acros
- Page 579:
market penetration of SRR systems a
- Page 582 and 583:
EUROPEAN COMMISSIONInformation Soci
- Page 584 and 585:
Table of contentsEXECUTIVE SUMMARY.
- Page 586 and 587:
2. EXECUTIVE SUMMARYThis report is
- Page 588 and 589:
2. In order to allow early introduc
- Page 590 and 591:
. forbidding of after-market salesc
- Page 592 and 593:
It shall be further noted that, for
- Page 594 and 595:
6. 2 PERMANENT FREQUENCY BAND FOR S
- Page 596 and 597:
7. 3 CONSIDERATION OF A TEMPORARY F
- Page 598 and 599:
• No compulsory refarming, even l
- Page 600 and 601:
The Radio Spectrum Committee and na
- Page 602 and 603:
In any case the review is not inten
- Page 604 and 605:
limit for SRR's. However, based on
- Page 606 and 607:
In order to avoid blocking of the R
- Page 608 and 609:
4.2 Protection of the Radio Astrono
- Page 610 and 611:
The protection of this fundamental
- Page 612 and 613:
The timescales for the designation
- Page 614 and 615:
industry. It shall be taken as a cl
- Page 617 and 618:
ANNEX 1MANDATE TO CEPT TO HARMONISE
- Page 619 and 620:
about a programmed phased approach
- Page 621 and 622:
- undertake all necessary technical
- Page 623:
Annex 2ECC/DEC/(04)03ELECTRONIC COM
- Page 626 and 627:
ECC/DEC/(04)03In order to support i
- Page 628 and 629:
ECC/DEC/(04)03studies conducted by
- Page 630 and 631:
ANNEX Annex 36to Doc ECC(04)53 Rev1
- Page 632 and 633:
EXPLANATORY MEMORANDUM13. INTRODUCT
- Page 634 and 635:
15. REQUIREMENT FOR AN ECC DECISION
- Page 636 and 637:
services and/or wide economical int
- Page 638 and 639:
x) that ECC Report 046 shows that S
- Page 640:
7. that the percentage of vehicles
- Page 644 and 645:
EUROPEAN COMMISSIONInformation Soci
- Page 646 and 647:
B. the temporary designation of 24
- Page 648 and 649:
harmful interference is an essentia
- Page 650 and 651:
For that purpose, several actions w
- Page 652:
On this final point, where the maxi
- Page 655 and 656:
29.7.2003 ENOfficial Journal of the
- Page 657 and 658:
29.7.2003 L 189/51Official Journal