to view Short Range Transit Plan FY 2007/2008 - Tri Delta Transit
to view Short Range Transit Plan FY 2007/2008 - Tri Delta Transit
to view Short Range Transit Plan FY 2007/2008 - Tri Delta Transit

You also want an ePaper? Increase the reach of your titles
YUMPU automatically turns print PDFs into web optimized ePapers that Google loves.
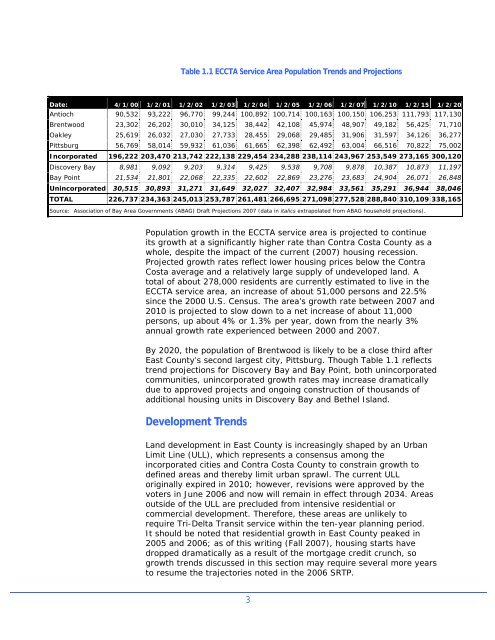
Table 1.1 ECCTA Service Area Population Trends and ProjectionsDate: 4/1/00 1/2/01 1/2/02 1/2/03 1/2/04 1/2/05 1/2/06 1/2/07 1/2/10 1/2/15 1/2/20Antioch 90,532 93,222 96,770 99,244 100,892 100,714 100,163 100,150 106,253 111,793 117,130Brentwood 23,302 26,202 30,010 34,125 38,442 42,108 45,974 48,907 49,182 56,425 71,710Oakley 25,619 26,032 27,030 27,733 28,455 29,068 29,485 31,906 31,597 34,126 36,277Pittsburg 56,769 58,014 59,932 61,036 61,665 62,398 62,492 63,004 66,516 70,822 75,002Incorporated 196,222 203,470 213,742 222,138 229,454 234,288 238,114 243,967 253,549 273,165 300,120Discovery Bay 8,981 9,092 9,203 9,314 9,425 9,538 9,708 9,878 10,387 10,873 11,197Bay Point 21,534 21,801 22,068 22,335 22,602 22,869 23,276 23,683 24,904 26,071 26,848Unincorporated 30,515 30,893 31,271 31,649 32,027 32,407 32,984 33,561 35,291 36,944 38,046TOTAL 226,737 234,363 245,013 253,787 261,481 266,695 271,098 277,528 288,840 310,109 338,165Source: Association of Bay Area Governments (ABAG) Draft Projections <strong>2007</strong> (data in italics extrapolated from ABAG household projections).Population growth in the ECCTA service area is projected <strong>to</strong> continueits growth at a significantly higher rate than Contra Costa County as awhole, despite the impact of the current (<strong>2007</strong>) housing recession.Projected growth rates reflect lower housing prices below the ContraCosta average and a relatively large supply of undeveloped land. A<strong>to</strong>tal of about 278,000 residents are currently estimated <strong>to</strong> live in theECCTA service area, an increase of about 51,000 persons and 22.5%since the 2000 U.S. Census. The area’s growth rate between <strong>2007</strong> and2010 is projected <strong>to</strong> slow down <strong>to</strong> a net increase of about 11,000persons, up about 4% or 1.3% per year, down from the nearly 3%annual growth rate experienced between 2000 and <strong>2007</strong>.By 2020, the population of Brentwood is likely <strong>to</strong> be a close third afterEast County’s second largest city, Pittsburg. Though Table 1.1 reflectstrend projections for Discovery Bay and Bay Point, both unincorporatedcommunities, unincorporated growth rates may increase dramaticallydue <strong>to</strong> approved projects and ongoing construction of thousands ofadditional housing units in Discovery Bay and Bethel Island.Development TrendsLand development in East County is increasingly shaped by an UrbanLimit Line (ULL), which represents a consensus among theincorporated cities and Contra Costa County <strong>to</strong> constrain growth <strong>to</strong>defined areas and thereby limit urban sprawl. The current ULLoriginally expired in 2010; however, revisions were approved by thevoters in June 2006 and now will remain in effect through 2034. Areasoutside of the ULL are precluded from intensive residential orcommercial development. Therefore, these areas are unlikely <strong>to</strong>require <strong>Tri</strong>-<strong>Delta</strong> <strong>Transit</strong> service within the ten-year planning period.It should be noted that residential growth in East County peaked in2005 and 2006; as of this writing (Fall <strong>2007</strong>), housing starts havedropped dramatically as a result of the mortgage credit crunch, sogrowth trends discussed in this section may require several more years<strong>to</strong> resume the trajec<strong>to</strong>ries noted in the 2006 SRTP.3