to view Short Range Transit Plan FY 2007/2008 - Tri Delta Transit
to view Short Range Transit Plan FY 2007/2008 - Tri Delta Transit
to view Short Range Transit Plan FY 2007/2008 - Tri Delta Transit

Create successful ePaper yourself
Turn your PDF publications into a flip-book with our unique Google optimized e-Paper software.
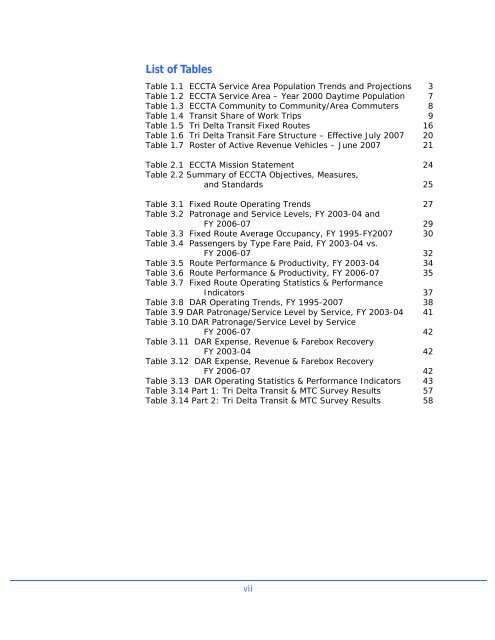
List of TablesTable 1.1 ECCTA Service Area Population Trends and Projections 3Table 1.2 ECCTA Service Area – Year 2000 Daytime Population 7Table 1.3 ECCTA Community <strong>to</strong> Community/Area Commuters 8Table 1.4 <strong>Transit</strong> Share of Work <strong>Tri</strong>ps 9Table 1.5 <strong>Tri</strong> <strong>Delta</strong> <strong>Transit</strong> Fixed Routes 16Table 1.6 <strong>Tri</strong> <strong>Delta</strong> <strong>Transit</strong> Fare Structure – Effective July <strong>2007</strong> 20Table 1.7 Roster of Active Revenue Vehicles – June <strong>2007</strong> 21Table 2.1 ECCTA Mission Statement 24Table 2.2 Summary of ECCTA Objectives, Measures,and Standards 25Table 3.1 Fixed Route Operating Trends 27Table 3.2 Patronage and Service Levels, <strong>FY</strong> 2003-04 and<strong>FY</strong> 2006-07 29Table 3.3 Fixed Route Average Occupancy, <strong>FY</strong> 1995-<strong>FY</strong><strong>2007</strong> 30Table 3.4 Passengers by Type Fare Paid, <strong>FY</strong> 2003-04 vs.<strong>FY</strong> 2006-07 32Table 3.5 Route Performance & Productivity, <strong>FY</strong> 2003-04 34Table 3.6 Route Performance & Productivity, <strong>FY</strong> 2006-07 35Table 3.7 Fixed Route Operating Statistics & PerformanceIndica<strong>to</strong>rs 37Table 3.8 DAR Operating Trends, <strong>FY</strong> 1995-<strong>2007</strong> 38Table 3.9 DAR Patronage/Service Level by Service, <strong>FY</strong> 2003-04 41Table 3.10 DAR Patronage/Service Level by Service<strong>FY</strong> 2006-07 42Table 3.11 DAR Expense, Revenue & Farebox Recovery<strong>FY</strong> 2003-04 42Table 3.12 DAR Expense, Revenue & Farebox Recovery<strong>FY</strong> 2006-07 42Table 3.13 DAR Operating Statistics & Performance Indica<strong>to</strong>rs 43Table 3.14 Part 1: <strong>Tri</strong> <strong>Delta</strong> <strong>Transit</strong> & MTC Survey Results 57Table 3.14 Part 2: <strong>Tri</strong> <strong>Delta</strong> <strong>Transit</strong> & MTC Survey Results 58vii