to view Short Range Transit Plan FY 2007/2008 - Tri Delta Transit
to view Short Range Transit Plan FY 2007/2008 - Tri Delta Transit
to view Short Range Transit Plan FY 2007/2008 - Tri Delta Transit

Create successful ePaper yourself
Turn your PDF publications into a flip-book with our unique Google optimized e-Paper software.
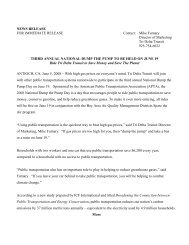
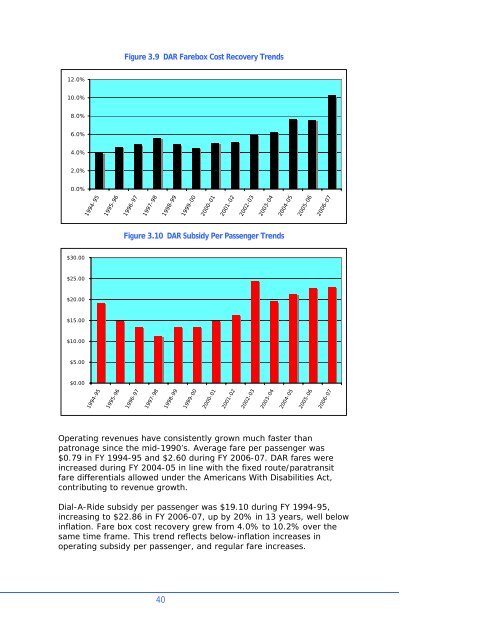
Figure 3.9 DAR Farebox Cost Recovery Trends12.0%10.0%8.0%6.0%4.0%2.0%0.0%1994-951995-961996-971997-981998-991999-002000-012001-022002-032003-042004-052005-062006-07Figure 3.10 DAR Subsidy Per Passenger Trends$30.00$25.00$20.00$15.00$10.00$5.00$0.001994-951995-961996-971997-981998-991999-002000-012001-022002-032003-042004-052005-062006-07Operating revenues have consistently grown much faster thanpatronage since the mid-1990’s. Average fare per passenger was$0.79 in <strong>FY</strong> 1994-95 and $2.60 during <strong>FY</strong> 2006-07. DAR fares wereincreased during <strong>FY</strong> 2004-05 in line with the fixed route/paratransitfare differentials allowed under the Americans With Disabilities Act,contributing <strong>to</strong> revenue growth.Dial-A-Ride subsidy per passenger was $19.10 during <strong>FY</strong> 1994-95,increasing <strong>to</strong> $22.86 in <strong>FY</strong> 2006-07, up by 20% in 13 years, well belowinflation. Fare box cost recovery grew from 4.0% <strong>to</strong> 10.2% over thesame time frame. This trend reflects below-inflation increases inoperating subsidy per passenger, and regular fare increases.40