to view Short Range Transit Plan FY 2007/2008 - Tri Delta Transit
to view Short Range Transit Plan FY 2007/2008 - Tri Delta Transit
to view Short Range Transit Plan FY 2007/2008 - Tri Delta Transit

Create successful ePaper yourself
Turn your PDF publications into a flip-book with our unique Google optimized e-Paper software.
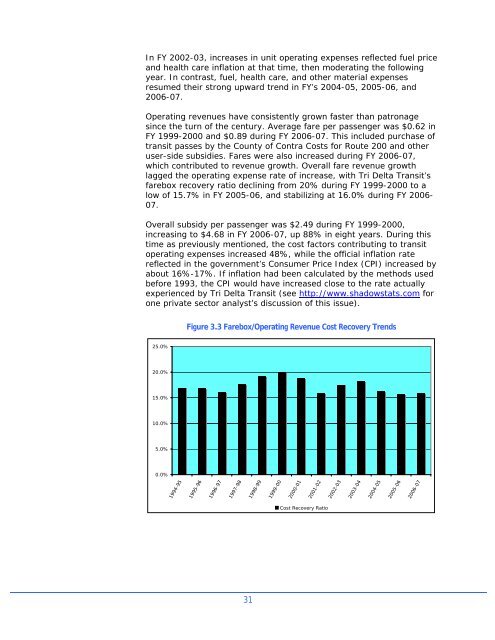
In <strong>FY</strong> 2002-03, increases in unit operating expenses reflected fuel priceand health care inflation at that time, then moderating the followingyear. In contrast, fuel, health care, and other material expensesresumed their strong upward trend in <strong>FY</strong>’s 2004-05, 2005-06, and2006-07.Operating revenues have consistently grown faster than patronagesince the turn of the century. Average fare per passenger was $0.62 in<strong>FY</strong> 1999-2000 and $0.89 during <strong>FY</strong> 2006-07. This included purchase oftransit passes by the County of Contra Costs for Route 200 and otheruser-side subsidies. Fares were also increased during <strong>FY</strong> 2006-07,which contributed <strong>to</strong> revenue growth. Overall fare revenue growthlagged the operating expense rate of increase, with <strong>Tri</strong> <strong>Delta</strong> <strong>Transit</strong>’sfarebox recovery ratio declining from 20% during <strong>FY</strong> 1999-2000 <strong>to</strong> alow of 15.7% in <strong>FY</strong> 2005-06, and stabilizing at 16.0% during <strong>FY</strong> 2006-07.Overall subsidy per passenger was $2.49 during <strong>FY</strong> 1999-2000,increasing <strong>to</strong> $4.68 in <strong>FY</strong> 2006-07, up 88% in eight years. During thistime as previously mentioned, the cost fac<strong>to</strong>rs contributing <strong>to</strong> transi<strong>to</strong>perating expenses increased 48%, while the official inflation ratereflected in the government’s Consumer Price Index (CPI) increased byabout 16%-17%. If inflation had been calculated by the methods usedbefore 1993, the CPI would have increased close <strong>to</strong> the rate actuallyexperienced by <strong>Tri</strong> <strong>Delta</strong> <strong>Transit</strong> (see http://www.shadowstats.com forone private sec<strong>to</strong>r analyst’s discussion of this issue).Figure 3.3 Farebox/Operating Revenue Cost Recovery Trends25.0%20.0%15.0%10.0%5.0%0.0%1994-951995-961996-971997-981998-991999-002000-012001-022002-032003-042004-052005-062006-07Cost Recovery Ratio31