to view Short Range Transit Plan FY 2007/2008 - Tri Delta Transit
to view Short Range Transit Plan FY 2007/2008 - Tri Delta Transit
to view Short Range Transit Plan FY 2007/2008 - Tri Delta Transit

Create successful ePaper yourself
Turn your PDF publications into a flip-book with our unique Google optimized e-Paper software.
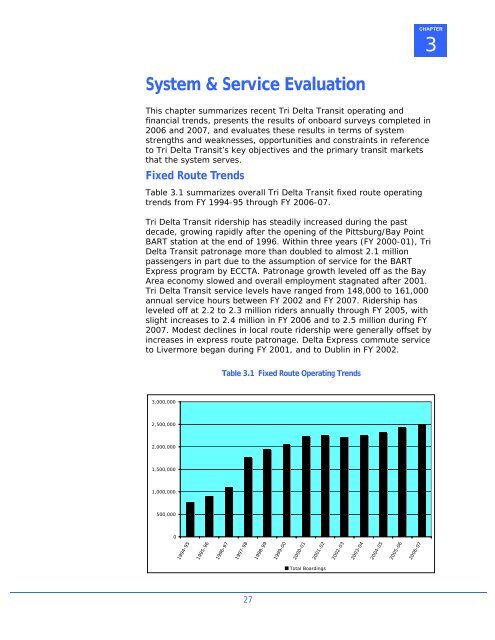
CHAPTER3System & Service EvaluationThis chapter summarizes recent <strong>Tri</strong> <strong>Delta</strong> <strong>Transit</strong> operating andfinancial trends, presents the results of onboard surveys completed in2006 and <strong>2007</strong>, and evaluates these results in terms of systemstrengths and weaknesses, opportunities and constraints in reference<strong>to</strong> <strong>Tri</strong> <strong>Delta</strong> <strong>Transit</strong>’s key objectives and the primary transit marketsthat the system serves.Fixed Route TrendsTable 3.1 summarizes overall <strong>Tri</strong> <strong>Delta</strong> <strong>Transit</strong> fixed route operatingtrends from <strong>FY</strong> 1994-95 through <strong>FY</strong> 2006-07.<strong>Tri</strong> <strong>Delta</strong> <strong>Transit</strong> ridership has steadily increased during the pastdecade, growing rapidly after the opening of the Pittsburg/Bay PointBART station at the end of 1996. Within three years (<strong>FY</strong> 2000-01), <strong>Tri</strong><strong>Delta</strong> <strong>Transit</strong> patronage more than doubled <strong>to</strong> almost 2.1 millionpassengers in part due <strong>to</strong> the assumption of service for the BARTExpress program by ECCTA. Patronage growth leveled off as the BayArea economy slowed and overall employment stagnated after 2001.<strong>Tri</strong> <strong>Delta</strong> <strong>Transit</strong> service levels have ranged from 148,000 <strong>to</strong> 161,000annual service hours between <strong>FY</strong> 2002 and <strong>FY</strong> <strong>2007</strong>. Ridership hasleveled off at 2.2 <strong>to</strong> 2.3 million riders annually through <strong>FY</strong> 2005, withslight increases <strong>to</strong> 2.4 million in <strong>FY</strong> 2006 and <strong>to</strong> 2.5 million during <strong>FY</strong><strong>2007</strong>. Modest declines in local route ridership were generally offset byincreases in express route patronage. <strong>Delta</strong> Express commute service<strong>to</strong> Livermore began during <strong>FY</strong> 2001, and <strong>to</strong> Dublin in <strong>FY</strong> 2002.Table 3.1 Fixed Route Operating Trends3,000,0002,500,0002,000,0001,500,0001,000,000500,00001994-951995-961996-971997-981998-991999-002000-012001-022002-032003-042004-052005-062006-07Total Boardings27