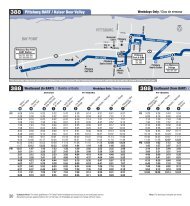
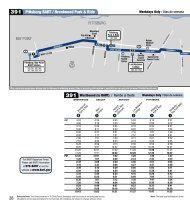
Berkeley, Oakland, Alameda, Albany and Emeryville area of the CentralEast Bay; 8.5% <strong>to</strong> San Francisco and San Mateo Counties; 4% <strong>to</strong>Dublin, Pleasan<strong>to</strong>n, and Livermore; 3% <strong>to</strong> the North Bay (Marin, Napa,Solano and Sonoma Counties); 2.5% <strong>to</strong> Santa Clara County, 2.5% <strong>to</strong>West Contra Costa County (Richmond, Pinole, El Sobrante, El Cerri<strong>to</strong>,Hercules and Rodeo); and about 10% <strong>to</strong> other locations (out of the BayArea, rural communities not identified, etc.)As mentioned in the Development Trends section above, most jobs inAntioch are concentrated around the Highway 4/Somersville Roadshopping area, with smaller concentrations in down<strong>to</strong>wn Antioch, thenortheast industrial area between down<strong>to</strong>wn and Highway 4, and theremainder scattered throughout the community.In Pittsburg, most jobs are located in the Loveridge Road and LelandRoad area in the vicinity of Los Medanos College, primarily south of theHighway 4 freeway.Brentwood has the third largest concentration of jobs, primarily locatedin the central areas of the community.Table 1.3 ECCTA Community <strong>to</strong> Community/ Area CommutersMartinez 40 90 280 1,110 830 340 2,690Concord 125 440 1,405 4,545 3,470 1,485 11,470Walnut Creek 145 300 715 3,025 2,050 740 6,975Other Central Contra Costa 259 454 735 3,625 2,460 1,115 8,648TO/FROMDiscoveryBayBrentwoodOakley Antioch PittsburgBayPoint TOTALDiscovery Bay 560 50 60 30 15 0 715Brentwood 375 2,260 705 685 135 60 4,220Oakley 170 205 1,310 440 105 485 2,715Antioch 85 575 1,445 9,720 1,345 330 13,500Pittsburg 70 240 600 3,400 4,550 555 9,415Bay Point 0 15 35 220 210 595 1,075West CC County 45 124 300 965 790 234 2,458Oakland-Berkeley-Alameda-Albany-Emeryville225 480 570 2,845 1,724 730 6,574Dublin-Pleasan<strong>to</strong>n-Livermore 615 1,055 690 699 560 265 3,884San Francisco 65 310 310 2,645 2,040 840 6,210San Mateo Co. 114 159 143 1,340 329 118 2,203Solano-Napa 34 120 250 1,384 469 154 2,411Sonoma-Marin 0 61 10 149 164 35 419Santa Clara Co. 444 480 433 735 303 55 2,450Other 1,095 1,540 1,692 2,942 2,305 353 9,927TOTAL 4,466 8,958 11,688 40,504 23,854 8,489 97,959Source: 2000 U.S. Census Journey <strong>to</strong> Work data<strong>Transit</strong> Share of Commute <strong>Tri</strong>psAccording <strong>to</strong> the 2000 U.S. Census, transit’s share of <strong>to</strong>tal commutertrips in each East Contra Costa County community gradually declinesas access distance increases <strong>to</strong> the Pittsburg/Bay Point BART station.8
This data is presented in Table 1.4. <strong>Transit</strong> share of <strong>to</strong>tal commutertrips exceeds 8% in Bay Point and Pittsburg within 0-4 miles of theBART station. <strong>Transit</strong> share is about 4% in Antioch, which is locatedbetween 7 and 13 miles away from BART. <strong>Transit</strong> share declinesfurther <strong>to</strong> only about 2% in both Oakley and Brentwood, between 15and 21 miles from BART. Discovery Bay’s transit mode share is only1.4%, at a distance of 28 <strong>to</strong> 31 miles from Pittsburg/Bay Point BART.This direct relationship between mode share and distance from BARTsuggests that high quality transit service, whether rail such as theproposed eBART line, or “bus rapid transit” (BRT) could potentiallyincrease overall transit usage. The potential for BRT <strong>to</strong> supplementexisting BART service and the proposed eBART route is examined inChapter Four.Table 1.4 <strong>Transit</strong> Share of Work <strong>Tri</strong>psTypical Mileage <strong>to</strong> <strong>Transit</strong> CommuteCommunityBay Point BARTShareDiscovery Bay 28-31 miles 1.4%Brentwood 20-21 miles 2.3%Oakley 15-16 miles 2.1%Antioch 7-13 miles 4.4%Pittsburg 3-4 miles 8.3%Bay Point