to view Short Range Transit Plan FY 2007/2008 - Tri Delta Transit
to view Short Range Transit Plan FY 2007/2008 - Tri Delta Transit
to view Short Range Transit Plan FY 2007/2008 - Tri Delta Transit

You also want an ePaper? Increase the reach of your titles
YUMPU automatically turns print PDFs into web optimized ePapers that Google loves.
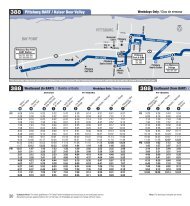
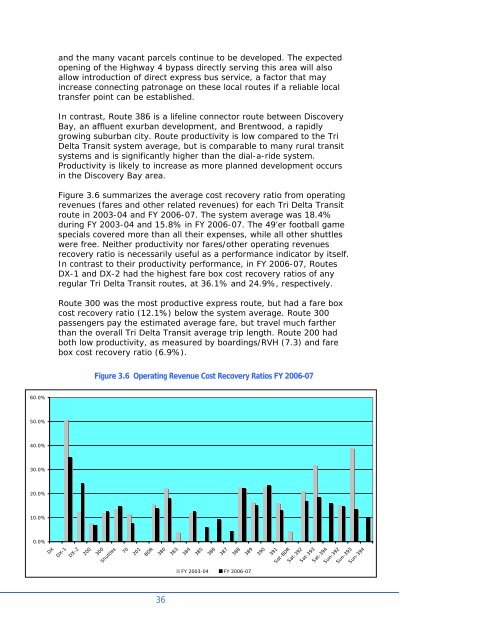
and the many vacant parcels continue <strong>to</strong> be developed. The expectedopening of the Highway 4 bypass directly serving this area will alsoallow introduction of direct express bus service, a fac<strong>to</strong>r that mayincrease connecting patronage on these local routes if a reliable localtransfer point can be established.In contrast, Route 386 is a lifeline connec<strong>to</strong>r route between DiscoveryBay, an affluent exurban development, and Brentwood, a rapidlygrowing suburban city. Route productivity is low compared <strong>to</strong> the <strong>Tri</strong><strong>Delta</strong> <strong>Transit</strong> system average, but is comparable <strong>to</strong> many rural transitsystems and is significantly higher than the dial-a-ride system.Productivity is likely <strong>to</strong> increase as more planned development occursin the Discovery Bay area.Figure 3.6 summarizes the average cost recovery ratio from operatingrevenues (fares and other related revenues) for each <strong>Tri</strong> <strong>Delta</strong> <strong>Transit</strong>route in 2003-04 and <strong>FY</strong> 2006-07. The system average was 18.4%during <strong>FY</strong> 2003-04 and 15.8% in <strong>FY</strong> 2006-07. The 49’er football gamespecials covered more than all their expenses, while all other shuttleswere free. Neither productivity nor fares/other operating revenuesrecovery ratio is necessarily useful as a performance indica<strong>to</strong>r by itself.In contrast <strong>to</strong> their productivity performance, in <strong>FY</strong> 2006-07, RoutesDX-1 and DX-2 had the highest fare box cost recovery ratios of anyregular <strong>Tri</strong> <strong>Delta</strong> <strong>Transit</strong> routes, at 36.1% and 24.9%, respectively.Route 300 was the most productive express route, but had a fare boxcost recovery ratio (12.1%) below the system average. Route 300passengers pay the estimated average fare, but travel much fartherthan the overall <strong>Tri</strong> <strong>Delta</strong> <strong>Transit</strong> average trip length. Route 200 hadboth low productivity, as measured by boardings/RVH (7.3) and farebox cost recovery ratio (6.9%).Figure 3.6 Operating Revenue Cost Recovery Ratios <strong>FY</strong> 2006-0760.0%50.0%40.0%30.0%20.0%10.0%0.0%DXDX-1DX-2200300Shuttles70201BDR380383384385386387388389390391Sat-BDRSat-392Sat-393Sat-394Sun-392Sun-393Sun-394<strong>FY</strong> 2003-04 <strong>FY</strong> 2006-0736