to view Short Range Transit Plan FY 2007/2008 - Tri Delta Transit
to view Short Range Transit Plan FY 2007/2008 - Tri Delta Transit
to view Short Range Transit Plan FY 2007/2008 - Tri Delta Transit

You also want an ePaper? Increase the reach of your titles
YUMPU automatically turns print PDFs into web optimized ePapers that Google loves.
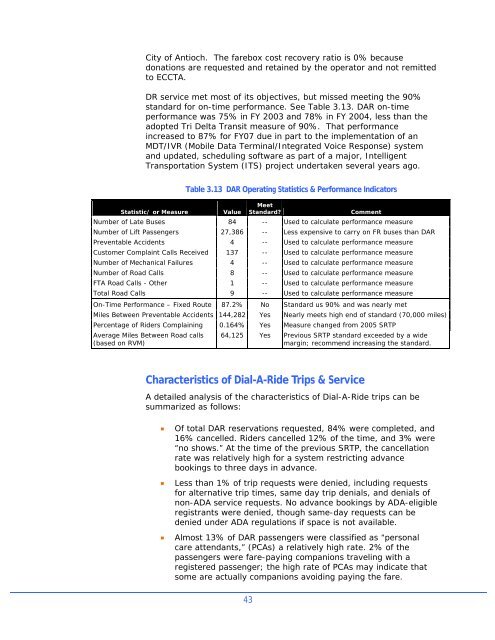
City of Antioch. The farebox cost recovery ratio is 0% becausedonations are requested and retained by the opera<strong>to</strong>r and not remitted<strong>to</strong> ECCTA.DR service met most of its objectives, but missed meeting the 90%standard for on-time performance. See Table 3.13. DAR on-timeperformance was 75% in <strong>FY</strong> 2003 and 78% in <strong>FY</strong> 2004, less than theadopted <strong>Tri</strong> <strong>Delta</strong> <strong>Transit</strong> measure of 90%. That performanceincreased <strong>to</strong> 87% for <strong>FY</strong>07 due in part <strong>to</strong> the implementation of anMDT/IVR (Mobile Data Terminal/Integrated Voice Response) systemand updated, scheduling software as part of a major, IntelligentTransportation System (ITS) project undertaken several years ago.Table 3.13 DAR Operating Statistics & Performance Indica<strong>to</strong>rsStatistic/ or MeasureValueMeetStandard?CommentNumber of Late Buses 84 -- Used <strong>to</strong> calculate performance measureNumber of Lift Passengers 27,386 -- Less expensive <strong>to</strong> carry on FR buses than DARPreventable Accidents 4 -- Used <strong>to</strong> calculate performance measureCus<strong>to</strong>mer Complaint Calls Received 137 -- Used <strong>to</strong> calculate performance measureNumber of Mechanical Failures 4 -- Used <strong>to</strong> calculate performance measureNumber of Road Calls 8 -- Used <strong>to</strong> calculate performance measureFTA Road Calls - Other 1 -- Used <strong>to</strong> calculate performance measureTotal Road Calls 9 -- Used <strong>to</strong> calculate performance measureOn-Time Performance – Fixed Route 87.2% No Standard us 90% and was nearly metMiles Between Preventable Accidents 144,282 Yes Nearly meets high end of standard (70,000 miles)Percentage of Riders Complaining 0.164% Yes Measure changed from 2005 SRTPAverage Miles Between Road calls(based on RVM)64,125 Yes Previous SRTP standard exceeded by a widemargin; recommend increasing the standard.Characteristics of Dial-A-Ride <strong>Tri</strong>ps & ServiceA detailed analysis of the characteristics of Dial-A-Ride trips can besummarized as follows:• Of <strong>to</strong>tal DAR reservations requested, 84% were completed, and16% cancelled. Riders cancelled 12% of the time, and 3% were“no shows.” At the time of the previous SRTP, the cancellationrate was relatively high for a system restricting advancebookings <strong>to</strong> three days in advance.• Less than 1% of trip requests were denied, including requestsfor alternative trip times, same day trip denials, and denials ofnon-ADA service requests. No advance bookings by ADA-eligibleregistrants were denied, though same-day requests can bedenied under ADA regulations if space is not available.• Almost 13% of DAR passengers were classified as “personalcare attendants,” (PCAs) a relatively high rate. 2% of thepassengers were fare-paying companions traveling with aregistered passenger; the high rate of PCAs may indicate thatsome are actually companions avoiding paying the fare.43