Dial-A-Ride (DAR)/Paratransit TrendsTable 3.8 summarizes overall <strong>Tri</strong> <strong>Delta</strong> <strong>Transit</strong> dial-a-ride(DAR)/paratransit operating trends from <strong>FY</strong> 1994-95 through <strong>FY</strong> 2005-07, including key operating statistics, e.g., <strong>to</strong>tal boardings (Figure3.7), revenue vehicle hours (RVH), operating expenses and revenues(Figure 3.8), and net subsidies. Key performance measures are alsosummarized, including boardings/RVH, operating expense per RVH,cost inflation from year <strong>to</strong> year, farebox cost recovery ratio (Figure3.9) subsidy per passenger (Figure 3.10), and year-<strong>to</strong>-year change insubsidy per passenger.Between <strong>FY</strong> 1995 and <strong>FY</strong> <strong>2007</strong>, <strong>to</strong>tal <strong>Tri</strong> <strong>Delta</strong> <strong>Transit</strong> paratransitboardings increased 75%, while <strong>to</strong>tal service provided (RVH) increased210%, and operating expenses increased 250% in unadjusted dollars.In contrast, fare revenues increased 401%, resulting in only modestnet growth in subsidy per passenger from $19.10 in <strong>FY</strong> 1994-95 <strong>to</strong>$22.86 during <strong>FY</strong> 2006-07. Fare box cost recovery grew from 6.2%during <strong>FY</strong> 1994-05 <strong>to</strong> 10.2% in <strong>FY</strong> 2006-07. This includes no allowancefor non-fare, operating revenues from contractual services provided.The Transportation Development Act (TDA) requires that a minimum of10% of paratransit operating expenses be recovered from fares, or acombination of fares and “local support.” Although <strong>Tri</strong> <strong>Delta</strong> <strong>Transit</strong>met this minimum if <strong>FY</strong>07, the difference between actual farescollected and the 10% requirement are waived due <strong>to</strong> an existing halfcentsales tax for transportation levied in Contra Costa County.FiscalYearTotalBoardingsTable 3.8 DAR Operating Trends, <strong>FY</strong> 1995-<strong>2007</strong>RevenueVehicleHours(RVH)OperatingExpenseOperatingRevenuesNet SubsidyBoardingsPerRVHFareboxCostRatioOperatingExpensePer RVHRate ofOperatingCostIncreaseSubsidyPerPassenger1995 60,996 19,583 $1,212,944 $48,149 ($1,164,795) 3.1 4.0% $61.94 -- ($19.10) --ChangePercent1996 83,994 25,550 $1,301,412 $59,958 ($1,241,454) 3.3 4.6% $50.94 -17.8% ($14.78) 22.6%1997 92,685 28,677 $1,300,437 $63,341 ($1,237,096) 3.2 4.9% $45.35 -11.0% ($13.35) -9.7%1998 110,105 27,676 $1,300,922 $72,375 ($1,228,547) 4.0 5.6% $47.01 3.7% ($11.16) -16.4%1999 93,928 31,565 $1,314,000 $64,000 ($1,250,000) 3.0 4.9% $41.63 -11.4% ($13.31) 19.3%2000 98,442 35,776 $1,382,000 $62,000 ($1,320,000) 2.8 4.5% $38.63 -7.2% ($13.41) 0.8%2001 105,000 36,946 $1,642,000 $83,000 ($1,559,000) 2.8 5.1% $44.44 15.1% ($14.85) 10.7%2002 84,294 30,433 $1,443,000 $74,000 ($1,369,000) 2.8 5.1% $47.42 6.7% ($16.24) 9.4%2003 80,185 33,109 $2,076,938 $123,289 ($1,953,649) 2.4 5.9% $62.73 32.3% ($24.36) 50.0%2004 99,909 36,829 $2,070,230 $128,576 ($1,941,654) 2.7 6.2% $56.21 -10.4% ($19.43) 20.2%2005 104,090 41,457 $2,403,331 $183,775 ($2,219,556) 2.5 7.6% $57.97 3.1% ($21.32) 9.7%2006 102,678 43,928 $2,518,750 $215,701 ($2,303,049) 2.3 8.6% $57.34 -1.1% ($22.43) 6.3%<strong>2007</strong> 106,850 41,749 $2,720,946 $278,102 ($2,442,844) 2.6 10.2% $65.17 13.7% ($22.86) 0.8%38
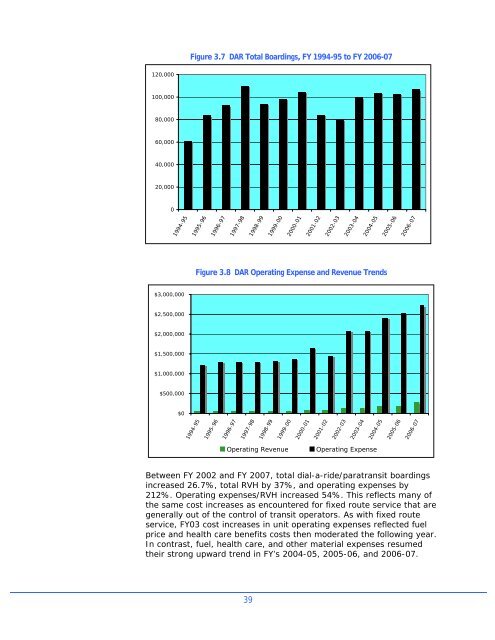
Figure 3.7 DAR Total Boardings, <strong>FY</strong> 1994-95 <strong>to</strong> <strong>FY</strong> 2006-07120,000100,00080,00060,00040,00020,00001994-951995-961996-971997-981998-991999-002000-012001-022002-032003-042004-052005-062006-07Figure 3.8 DAR Operating Expense and Revenue Trends$3,000,000$2,500,000$2,000,000$1,500,000$1,000,000$500,000$01994-951995-961996-971997-981998-991999-002000-012001-022002-032003-042004-052005-062006-07Operating RevenueOperating ExpenseBetween <strong>FY</strong> 2002 and <strong>FY</strong> <strong>2007</strong>, <strong>to</strong>tal dial-a-ride/paratransit boardingsincreased 26.7%, <strong>to</strong>tal RVH by 37%, and operating expenses by212%. Operating expenses/RVH increased 54%. This reflects many ofthe same cost increases as encountered for fixed route service that aregenerally out of the control of transit opera<strong>to</strong>rs. As with fixed routeservice, <strong>FY</strong>03 cost increases in unit operating expenses reflected fuelprice and health care benefits costs then moderated the following year.In contrast, fuel, health care, and other material expenses resumedtheir strong upward trend in <strong>FY</strong>’s 2004-05, 2005-06, and 2006-07.39