to view Short Range Transit Plan FY 2007/2008 - Tri Delta Transit
to view Short Range Transit Plan FY 2007/2008 - Tri Delta Transit
to view Short Range Transit Plan FY 2007/2008 - Tri Delta Transit

Create successful ePaper yourself
Turn your PDF publications into a flip-book with our unique Google optimized e-Paper software.
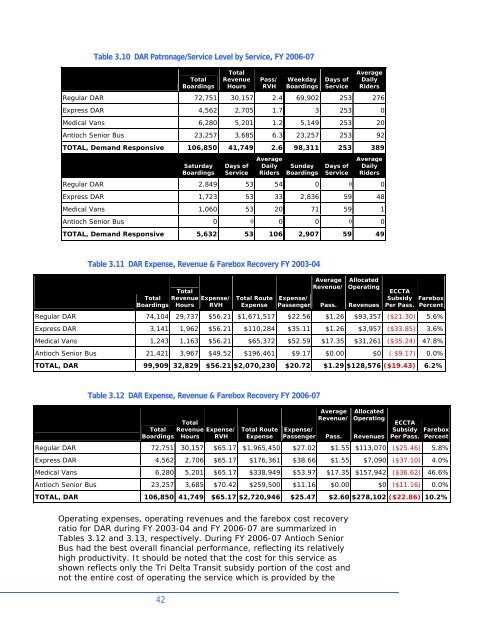
Table 3.10 DAR Patronage/Service Level by Service, <strong>FY</strong> 2006-07TotalBoardingsTotalRevenueHoursPass/RVHWeekdayBoardingsDays ofServiceAverageDailyRidersRegular DAR 72,751 30,157 2.4 69,902 253 276Express DAR 4,562 2,705 1.7 3 253 0Medical Vans 6,280 5,201 1.2 5,149 253 20Antioch Senior Bus 23,257 3,685 6.3 23,257 253 92TOTAL, Demand Responsive 106,850 41,749 2.6 98,311 253 389SaturdayBoardingsDays ofServiceAverageDailyRidersSundayBoardingsDays ofServiceAverageDailyRidersRegular DAR 2,849 53 54 0 0 0Express DAR 1,723 53 33 2,836 59 48Medical Vans 1,060 53 20 71 59 1Antioch Senior Bus 0 0 0 0 0 0TOTAL, Demand Responsive 5,632 53 106 2,907 59 49Table 3.11 DAR Expense, Revenue & Farebox Recovery <strong>FY</strong> 2003-04TotalTotal Revenue Expense/Boardings Hours RVHTotal RouteExpenseExpense/PassengerAverageRevenue/Pass.AllocatedOperatingRevenuesECCTASubsidyPer Pass.FareboxPercentRegular DAR 74,104 29,737 $56.21 $1,671,517 $22.56 $1.26 $93,357 ($21.30) 5.6%Express DAR 3,141 1,962 $56.21 $110,284 $35.11 $1.26 $3,957 ($33.85) 3.6%Medical Vans 1,243 1,163 $56.21 $65,372 $52.59 $17.35 $31,261 ($35.24) 47.8%Antioch Senior Bus 21,421 3,967 $49.52 $196,461 $9.17 $0.00 $0 ( $9.17) 0.0%TOTAL, DAR 99,909 32,829 $56.21 $2,070,230 $20.72 $1.29 $128,576 ($19.43) 6.2%Table 3.12 DAR Expense, Revenue & Farebox Recovery <strong>FY</strong> 2006-07TotalTotal Revenue Expense/Boardings Hours RVHTotal RouteExpenseExpense/PassengerAverageRevenue/Pass.AllocatedOperatingRevenuesECCTASubsidyPer Pass.FareboxPercentRegular DAR 72,751 30,157 $65.17 $1,965,450 $27.02 $1.55 $113,070 ($25.46) 5.8%Express DAR 4,562 2,706 $65.17 $176,361 $38.66 $1.55 $7,090 ($37.10) 4.0%Medical Vans 6,280 5,201 $65.17 $338,949 $53.97 $17.35 $157,942 ($36.62) 46.6%Antioch Senior Bus 23,257 3,685 $70.42 $259,500 $11.16 $0.00 $0 ($11.16) 0.0%TOTAL, DAR 106,850 41,749 $65.17 $2,720,946 $25.47 $2.60 $278,102 ($22.86) 10.2%Operating expenses, operating revenues and the farebox cost recoveryratio for DAR during <strong>FY</strong> 2003-04 and <strong>FY</strong> 2006-07 are summarized inTables 3.12 and 3.13, respectively. During <strong>FY</strong> 2006-07 Antioch SeniorBus had the best overall financial performance, reflecting its relativelyhigh productivity. It should be noted that the cost for this service asshown reflects only the <strong>Tri</strong> <strong>Delta</strong> <strong>Transit</strong> subsidy portion of the cost andnot the entire cost of operating the service which is provided by the42