to view Short Range Transit Plan FY 2007/2008 - Tri Delta Transit
to view Short Range Transit Plan FY 2007/2008 - Tri Delta Transit
to view Short Range Transit Plan FY 2007/2008 - Tri Delta Transit

Create successful ePaper yourself
Turn your PDF publications into a flip-book with our unique Google optimized e-Paper software.
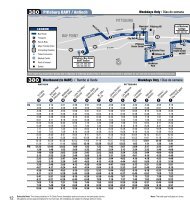
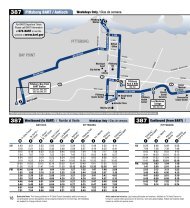
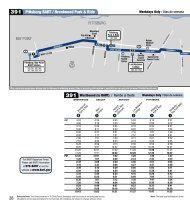
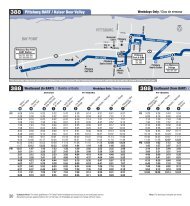
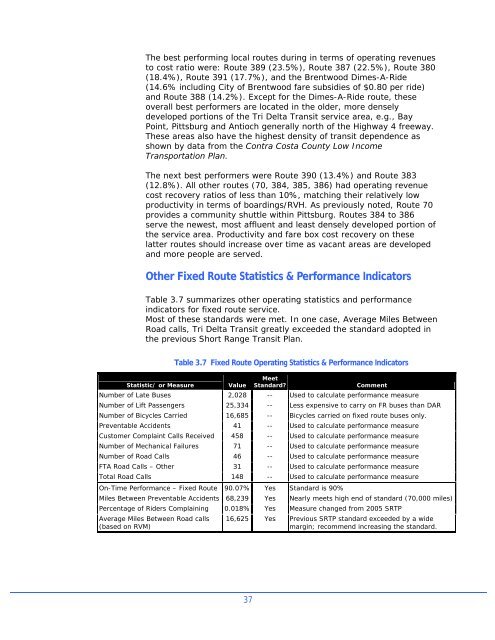
The best performing local routes during in terms of operating revenues<strong>to</strong> cost ratio were: Route 389 (23.5%), Route 387 (22.5%), Route 380(18.4%), Route 391 (17.7%), and the Brentwood Dimes-A-Ride(14.6% including City of Brentwood fare subsidies of $0.80 per ride)and Route 388 (14.2%). Except for the Dimes-A-Ride route, theseoverall best performers are located in the older, more denselydeveloped portions of the <strong>Tri</strong> <strong>Delta</strong> <strong>Transit</strong> service area, e.g., BayPoint, Pittsburg and Antioch generally north of the Highway 4 freeway.These areas also have the highest density of transit dependence asshown by data from the Contra Costa County Low IncomeTransportation <strong>Plan</strong>.The next best performers were Route 390 (13.4%) and Route 383(12.8%). All other routes (70, 384, 385, 386) had operating revenuecost recovery ratios of less than 10%, matching their relatively lowproductivity in terms of boardings/RVH. As previously noted, Route 70provides a community shuttle within Pittsburg. Routes 384 <strong>to</strong> 386serve the newest, most affluent and least densely developed portion ofthe service area. Productivity and fare box cost recovery on theselatter routes should increase over time as vacant areas are developedand more people are served.Other Fixed Route Statistics & Performance Indica<strong>to</strong>rsTable 3.7 summarizes other operating statistics and performanceindica<strong>to</strong>rs for fixed route service.Most of these standards were met. In one case, Average Miles BetweenRoad calls, <strong>Tri</strong> <strong>Delta</strong> <strong>Transit</strong> greatly exceeded the standard adopted inthe previous <strong>Short</strong> <strong>Range</strong> <strong>Transit</strong> <strong>Plan</strong>.Table 3.7 Fixed Route Operating Statistics & Performance Indica<strong>to</strong>rsStatistic/ or MeasureValueMeetStandard?CommentNumber of Late Buses 2,028 -- Used <strong>to</strong> calculate performance measureNumber of Lift Passengers 25,334 -- Less expensive <strong>to</strong> carry on FR buses than DARNumber of Bicycles Carried 16,685 -- Bicycles carried on fixed route buses only.Preventable Accidents 41 -- Used <strong>to</strong> calculate performance measureCus<strong>to</strong>mer Complaint Calls Received 458 -- Used <strong>to</strong> calculate performance measureNumber of Mechanical Failures 71 -- Used <strong>to</strong> calculate performance measureNumber of Road Calls 46 -- Used <strong>to</strong> calculate performance measureFTA Road Calls – Other 31 -- Used <strong>to</strong> calculate performance measureTotal Road Calls 148 -- Used <strong>to</strong> calculate performance measureOn-Time Performance – Fixed Route 90.07% Yes Standard is 90%Miles Between Preventable Accidents 68,239 Yes Nearly meets high end of standard (70,000 miles)Percentage of Riders Complaining 0.018% Yes Measure changed from 2005 SRTPAverage Miles Between Road calls(based on RVM)16,625 Yes Previous SRTP standard exceeded by a widemargin; recommend increasing the standard.37