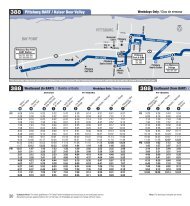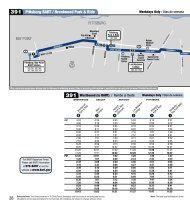
to view Short Range Transit Plan FY 2007/2008 - Tri Delta Transit
to view Short Range Transit Plan FY 2007/2008 - Tri Delta Transit
to view Short Range Transit Plan FY 2007/2008 - Tri Delta Transit

You also want an ePaper? Increase the reach of your titles
YUMPU automatically turns print PDFs into web optimized ePapers that Google loves.
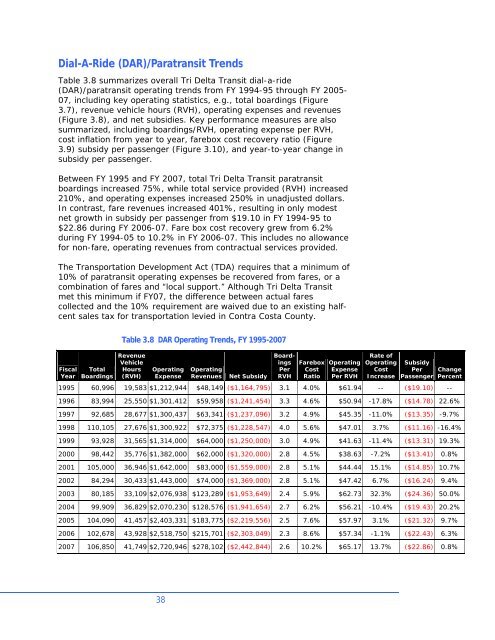
Dial-A-Ride (DAR)/Paratransit TrendsTable 3.8 summarizes overall <strong>Tri</strong> <strong>Delta</strong> <strong>Transit</strong> dial-a-ride(DAR)/paratransit operating trends from <strong>FY</strong> 1994-95 through <strong>FY</strong> 2005-07, including key operating statistics, e.g., <strong>to</strong>tal boardings (Figure3.7), revenue vehicle hours (RVH), operating expenses and revenues(Figure 3.8), and net subsidies. Key performance measures are alsosummarized, including boardings/RVH, operating expense per RVH,cost inflation from year <strong>to</strong> year, farebox cost recovery ratio (Figure3.9) subsidy per passenger (Figure 3.10), and year-<strong>to</strong>-year change insubsidy per passenger.Between <strong>FY</strong> 1995 and <strong>FY</strong> <strong>2007</strong>, <strong>to</strong>tal <strong>Tri</strong> <strong>Delta</strong> <strong>Transit</strong> paratransitboardings increased 75%, while <strong>to</strong>tal service provided (RVH) increased210%, and operating expenses increased 250% in unadjusted dollars.In contrast, fare revenues increased 401%, resulting in only modestnet growth in subsidy per passenger from $19.10 in <strong>FY</strong> 1994-95 <strong>to</strong>$22.86 during <strong>FY</strong> 2006-07. Fare box cost recovery grew from 6.2%during <strong>FY</strong> 1994-05 <strong>to</strong> 10.2% in <strong>FY</strong> 2006-07. This includes no allowancefor non-fare, operating revenues from contractual services provided.The Transportation Development Act (TDA) requires that a minimum of10% of paratransit operating expenses be recovered from fares, or acombination of fares and “local support.” Although <strong>Tri</strong> <strong>Delta</strong> <strong>Transit</strong>met this minimum if <strong>FY</strong>07, the difference between actual farescollected and the 10% requirement are waived due <strong>to</strong> an existing halfcentsales tax for transportation levied in Contra Costa County.FiscalYearTotalBoardingsTable 3.8 DAR Operating Trends, <strong>FY</strong> 1995-<strong>2007</strong>RevenueVehicleHours(RVH)OperatingExpenseOperatingRevenuesNet SubsidyBoardingsPerRVHFareboxCostRatioOperatingExpensePer RVHRate ofOperatingCostIncreaseSubsidyPerPassenger1995 60,996 19,583 $1,212,944 $48,149 ($1,164,795) 3.1 4.0% $61.94 -- ($19.10) --ChangePercent1996 83,994 25,550 $1,301,412 $59,958 ($1,241,454) 3.3 4.6% $50.94 -17.8% ($14.78) 22.6%1997 92,685 28,677 $1,300,437 $63,341 ($1,237,096) 3.2 4.9% $45.35 -11.0% ($13.35) -9.7%1998 110,105 27,676 $1,300,922 $72,375 ($1,228,547) 4.0 5.6% $47.01 3.7% ($11.16) -16.4%1999 93,928 31,565 $1,314,000 $64,000 ($1,250,000) 3.0 4.9% $41.63 -11.4% ($13.31) 19.3%2000 98,442 35,776 $1,382,000 $62,000 ($1,320,000) 2.8 4.5% $38.63 -7.2% ($13.41) 0.8%2001 105,000 36,946 $1,642,000 $83,000 ($1,559,000) 2.8 5.1% $44.44 15.1% ($14.85) 10.7%2002 84,294 30,433 $1,443,000 $74,000 ($1,369,000) 2.8 5.1% $47.42 6.7% ($16.24) 9.4%2003 80,185 33,109 $2,076,938 $123,289 ($1,953,649) 2.4 5.9% $62.73 32.3% ($24.36) 50.0%2004 99,909 36,829 $2,070,230 $128,576 ($1,941,654) 2.7 6.2% $56.21 -10.4% ($19.43) 20.2%2005 104,090 41,457 $2,403,331 $183,775 ($2,219,556) 2.5 7.6% $57.97 3.1% ($21.32) 9.7%2006 102,678 43,928 $2,518,750 $215,701 ($2,303,049) 2.3 8.6% $57.34 -1.1% ($22.43) 6.3%<strong>2007</strong> 106,850 41,749 $2,720,946 $278,102 ($2,442,844) 2.6 10.2% $65.17 13.7% ($22.86) 0.8%38