to view Short Range Transit Plan FY 2007/2008 - Tri Delta Transit
to view Short Range Transit Plan FY 2007/2008 - Tri Delta Transit
to view Short Range Transit Plan FY 2007/2008 - Tri Delta Transit

You also want an ePaper? Increase the reach of your titles
YUMPU automatically turns print PDFs into web optimized ePapers that Google loves.
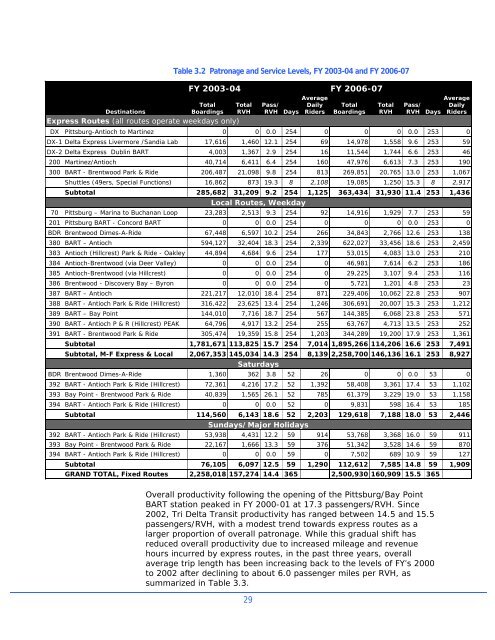
DestinationsTotalBoardingsTotalRVHExpress Routes (all routes operate weekdays only)Table 3.2 Patronage and Service Levels, <strong>FY</strong> 2003-04 and <strong>FY</strong> 2006-07<strong>FY</strong> 2003-04 <strong>FY</strong> 2006-07AveragePass/ DailyRVH Days RidersTotalBoardingsTotalRVHAveragePass/ DailyRVH Days RidersDX Pittsburg-Antioch <strong>to</strong> Martinez 0 0 0.0 254 0 0 0 0.0 253 0DX-1 <strong>Delta</strong> Express Livermore /Sandia Lab 17,616 1,460 12.1 254 69 14,978 1,558 9.6 253 59DX-2 <strong>Delta</strong> Express Dublin BART 4,003 1,367 2.9 254 16 11,544 1,744 6.6 253 46200 Martinez/Antioch 40,714 6,411 6.4 254 160 47,976 6,613 7.3 253 190300 BART - Brentwood Park & Ride 206,487 21,098 9.8 254 813 269,851 20,765 13.0 253 1,067Shuttles (49ers, Special Functions) 16,862 873 19.3 8 2,108 19,085 1,250 15.3 8 2,917Sub<strong>to</strong>tal 285,682 31,209 9.2 254 1,125 363,434 31,930 11.4 253 1,436Local Routes, Weekday70 Pittsburg – Marina <strong>to</strong> Buchanan Loop 23,283 2,513 9.3 254 92 14,916 1,929 7.7 253 59201 Pittsburg BART - Concord BART 0 0 0.0 254 0 0 0 0.0 253 0BDR Brentwood Dimes-A-Ride 67,448 6,597 10.2 254 266 34,843 2,766 12.6 253 138380 BART – Antioch 594,127 32,404 18.3 254 2,339 622,027 33,456 18.6 253 2,459383 Antioch (Hillcrest) Park & Ride - Oakley 44,894 4,684 9.6 254 177 53,015 4,083 13.0 253 210384 Antioch-Brentwood (via Deer Valley) 0 0 0.0 254 0 46,981 7,614 6.2 253 186385 Antioch-Brentwood (via Hillcrest) 0 0 0.0 254 0 29,225 3,107 9.4 253 116386 Brentwood - Discovery Bay – Byron 0 0 0.0 254 0 5,721 1,201 4.8 253 23387 BART – Antioch 221,217 12,010 18.4 254 871 229,406 10,062 22.8 253 907388 BART - Antioch Park & Ride (Hillcrest) 316,422 23,625 13.4 254 1,246 306,691 20,007 15.3 253 1,212389 BART – Bay Point 144,010 7,716 18.7 254 567 144,385 6,068 23.8 253 571390 BART - Antioch P & R (Hillcrest) PEAK 64,796 4,917 13.2 254 255 63,767 4,713 13.5 253 252391 BART - Brentwood Park & Ride 305,474 19,359 15.8 254 1,203 344,289 19,200 17.9 253 1,361Sub<strong>to</strong>tal 1,781,671 113,825 15.7 254 7,014 1,895,266 114,206 16.6 253 7,491Sub<strong>to</strong>tal, M-F Express & Local 2,067,353 145,034 14.3 254 8,139 2,258,700 146,136 16.1 253 8,927SaturdaysBDR Brentwood Dimes-A-Ride 1,360 362 3.8 52 26 0 0 0.0 53 0392 BART - Antioch Park & Ride (Hillcrest) 72,361 4,216 17.2 52 1,392 58,408 3,361 17.4 53 1,102393 Bay Point - Brentwood Park & Ride 40,839 1,565 26.1 52 785 61,379 3,229 19.0 53 1,158394 BART - Antioch Park & Ride (Hillcrest) 0 0 0.0 52 0 9,831 598 16.4 53 185Sub<strong>to</strong>tal 114,560 6,143 18.6 52 2,203 129,618 7,188 18.0 53 2,446Sundays/Major Holidays392 BART - Antioch Park & Ride (Hillcrest) 53,938 4,431 12.2 59 914 53,768 3,368 16.0 59 911393 Bay Point - Brentwood Park & Ride 22,167 1,666 13.3 59 376 51,342 3,528 14.6 59 870394 BART - Antioch Park & Ride (Hillcrest) 0 0 0.0 59 0 7,502 689 10.9 59 127Sub<strong>to</strong>tal 76,105 6,097 12.5 59 1,290 112,612 7,585 14.8 59 1,909GRAND TOTAL, Fixed Routes 2,258,018 157,274 14.4 365 2,500,930 160,909 15.5 365Overall productivity following the opening of the Pittsburg/Bay PointBART station peaked in <strong>FY</strong> 2000-01 at 17.3 passengers/RVH. Since2002, <strong>Tri</strong> <strong>Delta</strong> <strong>Transit</strong> productivity has ranged between 14.5 and 15.5passengers/RVH, with a modest trend <strong>to</strong>wards express routes as alarger proportion of overall patronage. While this gradual shift hasreduced overall productivity due <strong>to</strong> increased mileage and revenuehours incurred by express routes, in the past three years, overallaverage trip length has been increasing back <strong>to</strong> the levels of <strong>FY</strong>’s 2000<strong>to</strong> 2002 after declining <strong>to</strong> about 6.0 passenger miles per RVH, assummarized in Table 3.3.29