- Page 1:
Copyright 2004 by Marcel Dekker, In
- Page 4 and 5:
Copyright 2004 by Marcel Dekker, In
- Page 6 and 7:
Copyright 2004 by Marcel Dekker, In
- Page 8 and 9:
This book covers several topics of
- Page 10 and 11:
esult, some exciting topics were no
- Page 12 and 13:
3. Fine Structure and Polarization
- Page 14 and 15:
9. III-V Quantum Dots and Quantum D
- Page 16 and 17:
ContributorsUri BaninThe Hebrew Uni
- Page 18 and 19:
1‘‘Soft’’ Chemical Synthesi
- Page 20 and 21:
structure of energy states leads to
- Page 22 and 23:
growth can proceed by Ostwald ripen
- Page 24 and 25:
Figure 3 Transmission electron micr
- Page 26 and 27:
Figure 4 Temporal evolution of the
- Page 28 and 29:
No. 26, are f85% (Fig. 6) [21]. Alt
- Page 30 and 31:
tion spectra and broad PL spectra.
- Page 32 and 33:
ing surface-to-volume ratio with di
- Page 34 and 35:
Figure 8 Photoluminescence spectra
- Page 36 and 37:
lattice mismatch. Such a large latt
- Page 38 and 39:
match between InAs and ZnS of f11%.
- Page 40 and 41:
successfully repeated for up to thr
- Page 42 and 43:
Under a different growth regime, on
- Page 44 and 45:
Figure 14 Atomic model of the CdSe
- Page 46 and 47:
‘‘Teardrop-shaped’’ particl
- Page 48 and 49:
Figure 17 High-resolution TEMs of C
- Page 50 and 51:
allows isolation of tetrapods in f8
- Page 52 and 53:
ligand concentrations yield a reduc
- Page 54 and 55:
een determined and quantitatively c
- Page 56 and 57:
tion volumes were also shown to be
- Page 58 and 59:
synthesis temperatures of z400jC ar
- Page 60 and 61:
Figure 23 (a) Photoluminescence spe
- Page 62 and 63:
levels (fV1 Mn per NQD). Despite in
- Page 64 and 65:
Figure 25 X-ray diffraction pattern
- Page 66 and 67:
Figure 27 Transmission electron mic
- Page 68 and 69:
An additional factor that strongly
- Page 70 and 71:
Figure 30 (a,b) Schematics illustra
- Page 72 and 73:
Slow, controlled precipitation of h
- Page 74 and 75:
Figure 34 Schematic illustrating th
- Page 76 and 77:
Figure 36 Transmission electron mic
- Page 78 and 79:
achieving biological compatibility
- Page 80 and 81:
47. Yu H.; Gibbons P.C.; Kelton K.F
- Page 82 and 83:
2Electronic Structure inSemiconduct
- Page 84 and 85:
Figure 2 (a) Simple model of a nano
- Page 88 and 89:
electron and hole to be treated as
- Page 90 and 91:
independently, Eq. (13) is commonly
- Page 92:
a better description of the bulk ba
- Page 95 and 96: investigated. For optical experimen
- Page 97 and 98: Figure 4 (a) Absorption (solid line
- Page 99 and 100: Figure 6 Normalized PLE scans for s
- Page 101 and 102: Figure 8 A simplistic model for des
- Page 103 and 104: Figure 10 Theoretically predicted p
- Page 105 and 106: Figure 12 Schematics depicting the
- Page 107 and 108: Figure 14 Calculated band-edge exci
- Page 109 and 110: Figure 15 Absorption (solid line) a
- Page 111 and 112: Figure 18 (a) Calculated band-edge
- Page 113 and 114: IV.BEYOND CdSeA. Indium Arsenide Na
- Page 115 and 116: the six-band Luttinger Hamiltonian.
- Page 117 and 118: 11. Norris, D.J.; Efros, Al.L.; Ros
- Page 119 and 120: 69. Gaponenko, S.V.; Woggon, U.; Sa
- Page 121 and 122: formation of a long-lived dark exci
- Page 123 and 124: where the constant A is determined
- Page 125 and 126: In crystals for which the function
- Page 127 and 128: The respective wave functions areC
- Page 129 and 130: passive, as was shown in Ref. 12. T
- Page 131 and 132: square of the matrix element of the
- Page 133 and 134: where e F = e F ieV and e F F = e x
- Page 135 and 136: see that for all nanocrystal shapes
- Page 137 and 138: optical recombination of the excito
- Page 139 and 140: B. Recombination of the Dark Excito
- Page 141 and 142: where x = cos h and f = l B g e H/3
- Page 143: The theory of the polarization memo
- Page 147 and 148: state would have an infinite lifeti
- Page 149 and 150: crystal axis [see Eq. (40)]. As a r
- Page 151 and 152: time of the exciton momentum relaxa
- Page 153 and 154: One must also account for the influ
- Page 155 and 156: observed in one of the first studie
- Page 157 and 158: REFERENCES1. Bawendi, M.G.; Wilson,
- Page 159 and 160: 4Intraband Spectroscopyand Dynamics
- Page 161 and 162: The solid line in Fig. 1 shows the
- Page 163 and 164: Figure 2 FTIR spectra of n-type CdS
- Page 165 and 166: of the center frequency. The experi
- Page 167 and 168: limit given by radiative relaxation
- Page 169 and 170: from a long lifetime due to the pho
- Page 171 and 172: are two natural approaches to study
- Page 173 and 174: 32. Inoshita, T.; Sakaki, H. Physic
- Page 175 and 176: continuous spectral tunability over
- Page 177 and 178: function and envelope function mome
- Page 179 and 180: ottleneck’’ [14,28]. Further re
- Page 181 and 182: in NQDs is dominated by nonphonon e
- Page 183 and 184: Figure 4 Dynamics of the IR postpum
- Page 185 and 186: Figure 5 (a) Time-resolved PL spect
- Page 187 and 188: Figure 6 (a) The time delay of the
- Page 189 and 190: and due to Auger-type e-h interacti
- Page 191 and 192: Figure 9 Dynamics of the 1S bleachi
- Page 193 and 194: significantly greater than the fast
- Page 195 and 196:
Figure 11 (a) Pump-intensity-depend
- Page 197 and 198:
NQD size. For small NQD sizes (R =
- Page 199 and 200:
Figure 14 Nonlinear absorption/gain
- Page 201 and 202:
sorption change associated with a s
- Page 203 and 204:
where n h em is the hole ‘‘emit
- Page 205 and 206:
ultrafast (subpicosecond to picosec
- Page 207 and 208:
Figure 18 Schematic of transitions
- Page 209 and 210:
Figure 19 Dynamics of pump-induced
- Page 211 and 212:
where n i (i=1, 2 . . . , N ) is th
- Page 213 and 214:
Figure 21 (a) Two-e-h-pair (biexcit
- Page 215 and 216:
the volume fraction (filling factor
- Page 217 and 218:
intensity dependence of this peak (
- Page 219 and 220:
Copyright 2004 by Marcel Dekker, In
- Page 221 and 222:
can contribute to the saturation of
- Page 223 and 224:
Copyright 2004 by Marcel Dekker, In
- Page 225 and 226:
coupling between ‘‘volume’’
- Page 227 and 228:
numerous discussions on the photoph
- Page 229 and 230:
53. Kang, K.; Kepner, A.; Gaponenko
- Page 231 and 232:
the ‘‘on-off ’’ emission in
- Page 233 and 234:
parallel form of data acquisition i
- Page 235 and 236:
Figure 3 (a) Spectral time trace of
- Page 237 and 238:
transition energies. In fact, these
- Page 239 and 240:
distribution (dark line) does not d
- Page 241 and 242:
exposure to only room light. In our
- Page 243 and 244:
statistics for the off times are in
- Page 245 and 246:
230Shimizu and BawendiCopyright 200
- Page 247 and 248:
Figure 10 (a) Time trace of a CdSe(
- Page 249 and 250:
and excited QD core states to fluct
- Page 251 and 252:
arrows indicate the on-time truncat
- Page 253 and 254:
W. K. Woo and V. C. Sundar for assi
- Page 255 and 256:
size allows the electron affinity a
- Page 257 and 258:
II.THEORY OF ELECTRON TRANSFER BETW
- Page 259 and 260:
For the specific case of charge tra
- Page 261 and 262:
dominates, the mobility is often fi
- Page 263 and 264:
where the constant A and the temper
- Page 265 and 266:
components of modulation which are
- Page 267 and 268:
nanocrystals [41], understanding ph
- Page 269 and 270:
and ionization potential through tw
- Page 271 and 272:
quantum dots. Furthermore, because
- Page 273 and 274:
For many applications, a host mater
- Page 275 and 276:
form blends with morphologies that
- Page 277 and 278:
Figure 11 Photoluminescence efficie
- Page 279 and 280:
Figure 12 (a) Room-temperature PIA
- Page 281 and 282:
discussed briefly in Section IV. Ch
- Page 283 and 284:
dithiolates to thiol-terminated DNA
- Page 285 and 286:
Films of passivated CdSe nanocrysta
- Page 287 and 288:
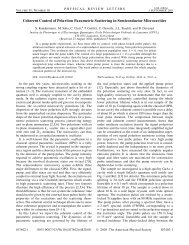
Figure 16 Photocurrent action spect
- Page 289 and 290:
decay with stretched exponential ki
- Page 291 and 292:
siderably larger than might be esti
- Page 293 and 294:
dispersing CdSe nanocrystal chromop
- Page 295 and 296:
memory and charge storage effects [
- Page 297 and 298:
all) of the optically excited elect
- Page 299 and 300:
composites of nanocrystals and conj
- Page 301 and 302:
55. Asbury, J.B.; Hao, E.C.; Wang,
- Page 303 and 304:
108. Morgan, N.Y.; Leatherdale, C.A
- Page 305 and 306:
The approaches to fabrication of se
- Page 307 and 308:
Figure 1 Experimental realization o
- Page 309 and 310:
Due to this voltage division, the m
- Page 311 and 312:
Figure 3 Simulated tunneling spectr
- Page 313 and 314:
electron charging. In both positive
- Page 315 and 316:
Figure 5 shows the typical features
- Page 317 and 318:
Figure 7 Map of levels for InAs nan
- Page 319 and 320:
Figure 8 Scanning electron microsco
- Page 321 and 322:
D CB = 0.31 eV is thus obtained. On
- Page 323 and 324:
Figure 11 Correlation of optical an
- Page 325 and 326:
atomistic approach based on pseudop
- Page 327 and 328:
charging indicated that the tunneli
- Page 329 and 330:
capacitance values were also kept t
- Page 331 and 332:
could not be detected in the QD/DT/
- Page 333 and 334:
Figure 18 Tunneling conductanceF sp
- Page 335 and 336:
data in the inset of Fig. 19 repres
- Page 337 and 338:
corresponding to the s-like wave fu
- Page 339 and 340:
7. Grabert, H.; Devoret, M.H., Eds.
- Page 341 and 342:
66. Su, B.; Goldman, V.J.; Cunningh
- Page 343 and 344:
dimensional confinement are created
- Page 345 and 346:
Figure 1 Transmission electron micr
- Page 347 and 348:
The room-temperature absorption and
- Page 349 and 350:
narrower in samples with larger mea
- Page 351 and 352:
GaInP 2 QDs from a plot of the squa
- Page 353 and 354:
crystal, indicating lattice-matched
- Page 355 and 356:
Figure 5 Evolution of Stranski-Kras
- Page 357 and 358:
Figure 7 Photoluminescence spectra
- Page 359 and 360:
Figure 8 Photoluminescence spectra
- Page 361 and 362:
C. Efficient Anti-Stokes Photolumin
- Page 363 and 364:
Because HF treatment has been shown
- Page 365 and 366:
Copyright 2004 by Marcel Dekker, In
- Page 367 and 368:
intensity of the PL when it is on a
- Page 369 and 370:
eV stems from recombining carriers
- Page 371 and 372:
Figure 16 Model to explain two-colo
- Page 373 and 374:
although this term is not rigorousl
- Page 375 and 376:
10 ps (about an order of magnitude
- Page 377 and 378:
electron relaxation is inhibited an
- Page 379 and 380:
Figure 18 Transmission electron mic
- Page 381 and 382:
QDs, the nature of the QD capping s
- Page 383 and 384:
QD solution. For an interdot distan
- Page 385 and 386:
emission spectra of the two individ
- Page 387 and 388:
Figure 23 Change of the PL intensit
- Page 389 and 390:
(viz. the absorbed light intensity)
- Page 391 and 392:
Figure 25Impact ionization in QDs.m
- Page 393 and 394:
prevent electron-hole recombination
- Page 395 and 396:
36. Miller, R.D.J.; McLendon, G.; N
- Page 397 and 398:
91. Vurgaftman, I.; Singh, J. Appl.
- Page 399 and 400:
139. Mićić, O.I.; Ahrenkiel, S.P.
- Page 401 and 402:
10Synthesis and Fabrication of Meta
- Page 403 and 404:
Figure 2 (A-C) Progression of HR-TE
- Page 405 and 406:
Figure 3 Schematic for gold nanocry
- Page 407 and 408:
Nanocrystal growth can occur by two
- Page 409 and 410:
on the other hand, provide an ensem
- Page 411 and 412:
Figure 6 (a) SAXS patterns for disp
- Page 413 and 414:
Figure 8 The gold nanocrystal film
- Page 415 and 416:
of the stabilizing ligand, and the
- Page 417 and 418:
successfully modeled the 2D island
- Page 419 and 420:
2. Steric Stabilization and a Soft
- Page 421 and 422:
are fully extended. Moving away fro
- Page 423 and 424:
Figure 11 High-resolution SEM image
- Page 425 and 426:
Figure 13 (A) Transmission electron
- Page 427 and 428:
function of the density of localize
- Page 429 and 430:
Figure 15 High-resolution SEM image
- Page 431 and 432:
thiol-capped nanocrystals [2]. The
- Page 433 and 434:
41. Ackerson, B.J. Nature 1993, 365
- Page 435 and 436:
with the effect of the particle com
- Page 437 and 438:
Figure 1a shows the surface plasmon
- Page 439 and 440:
Figure 2 (a) Ultraviolet-visible ab
- Page 441 and 442:
agents [34]. The short-wavelength b
- Page 443 and 444:
Figure 4 (a) Plot of the plasmon ab
- Page 445 and 446:
the framework of traditional Mie’
- Page 447 and 448:
show that effects due to the surrou
- Page 449 and 450:
is located at the position of the g
- Page 451 and 452:
Copyright 2004 by Marcel Dekker, In
- Page 453 and 454:
Figure 8 Ultraviolet-visible absorp
- Page 455 and 456:
laser pulses while being mixed in t
- Page 457 and 458:
Figure 10 shows HR-TEM images of go
- Page 459 and 460:
Figure 11 Transmission electron mic
- Page 461 and 462:
final irradiation product. At the s
- Page 463 and 464:
following the laser excitation appe
- Page 465 and 466:
36. Papavassiliou, G.C. Prog. Solid
- Page 467 and 468:
particles to expand. Because the he
- Page 469 and 470:
was frequency doubled in a 1-mm B-
- Page 471 and 472:
Figure 2 Frequency of the acoustic
- Page 473 and 474:
Figure 3 Change in radius (DR/R) ve
- Page 475 and 476:
In this model, the electrons couple
- Page 477 and 478:
Figure 5 Transient bleach data for
- Page 479 and 480:
Figure 7 (a) Transient bleach data
- Page 481 and 482:
that the particles with >80% Au hav
- Page 483 and 484:
3. Del Fatti, N.; Valle´e, F.; Fly