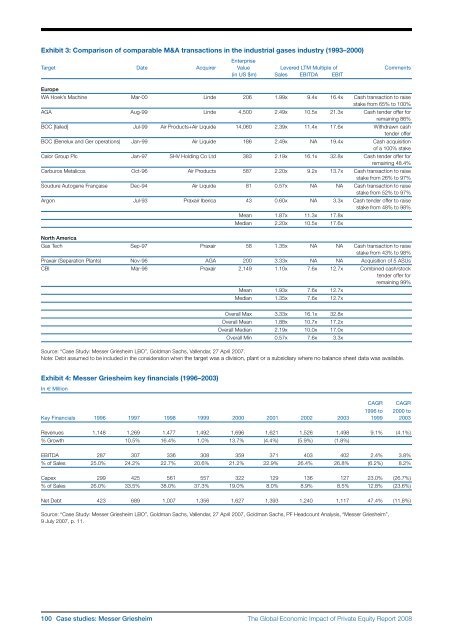
Exhibit 3: Comparison <strong>of</strong> comparable M&A transactions in the industrial gases industry (1993–2000)EnterpriseTarget Date Acquirer Value Levered LTM Multiple <strong>of</strong> Comments(in US $m) Sales EBITDA EBITEuropeWA Hoek’s Machine Mar-00 Linde 206 1.99x 9.4x 16.4x Cash transaction to raisestake from 65% to 100%AGA Aug-99 Linde 4,500 2.49x 10.5x 21.3x Cash tender <strong>of</strong>fer forremaining 86%BOC [failed] Jul-99 Air Products+Air Liquide 14,060 2.39x 11.4x 17.6x Withdrawn cashtender <strong>of</strong>ferBOC (Benelux and Ger operations) Jan-99 Air Liquide 186 2.49x NA 19.4x Cash acquisition<strong>of</strong> a 100% stakeCalor Group Plc Jan-97 SHV Holding Co Ltd 383 2.19x 16.1x 32.8x Cash tender <strong>of</strong>fer forremaining 48.4%Carburos Metalicos Oct-96 Air Products 587 2.20x 9.2x 13.7x Cash transaction to raisestake from 26% to 97%Soudure Autogene Française Dec-94 Air Liquide 81 0.57x NA NA Cash transaction to raisestake from 52% to 97%Argon Jul-93 Praxair Iberica 43 0.60x NA 3.3x Cash tender <strong>of</strong>fer to raisestake from 48% to 98%Mean 1.87x 11.3x 17.8xMedian 2.20x 10.5x 17.6xNorth AmericaGas Tech Sep-97 Praxair 58 1.35x NA NA Cash transaction to raisestake from 43% to 98%Praxair (Separation Plants) Nov-96 AGA 200 3.33x NA NA Acquisition <strong>of</strong> 5 ASUsCBI Mar-96 Praxair 2,149 1.10x 7.6x 12.7x Combined cash/stocktender <strong>of</strong>fer forremaining 99%Mean 1.93x 7.6x 12.7xMedian 1.35x 7.6x 12.7xOverall Max 3.33x 16.1x 32.8xOverall Mean 1.88x 10.7x 17.2xOverall Median 2.19x 10.0x 17.0xOverall Min 0.57x 7.6x 3.3xSource: “Case Study: Messer Griesheim LBO”, Goldman Sachs, Vallendar, 27 April 2007.Note: Debt assumed to be included in the consideration when the target was a division, plant or a subsidiary where no balance sheet data was available.Exhibit 4: Messer Griesheim key financials (1996–2003)In € Million1996 to 2000 toKey Financials 1996 1997 1998 1999 2000 2001 2002 2003 1999 2003CAGRCAGRRevenues 1,148 1,269 1,477 1,492 1,696 1,621 1,526 1,498 9.1% (4.1%)% Growth 10.5% 16.4% 1.0% 13.7% (4.4%) (5.9%) (1.8%)EBITDA 287 307 336 308 359 371 403 402 2.4% 3.8%% <strong>of</strong> Sales 25.0% 24.2% 22.7% 20.6% 21.2% 22.9% 26.4% 26.8% (6.2%) 8.2%Capex 299 425 561 557 322 129 136 127 23.0% (26.7%)% <strong>of</strong> Sales 26.0% 33.5% 38.0% 37.3% 19.0% 8.0% 8.9% 8.5% 12.8% (23.6%)Net Debt 423 689 1,007 1,356 1,627 1,393 1,240 1,117 47.4% (11.8%)Source: “Case Study: Messer Griesheim LBO”, Goldman Sachs, Vallendar, 27 April 2007, Goldman Sachs, PF Headcount Analysis, “Messer Griesheim”,9 July 2007, p. 11.100 Case studies: Messer Griesheim<strong>The</strong> <strong>Global</strong> <strong>Economic</strong> <strong>Impact</strong> <strong>of</strong> <strong>Private</strong> <strong>Equity</strong> <strong>Report</strong> <strong>2008</strong>
Exhibit 5: Post buyout structureMesser Industrie a Allianz Capital Partners Goldman Sachs Messer Employees32.1% 33.1% 33.1% 1.7%Messer GriesheimMesser Griesheim GmbHGerman OperationsMesser USMesser UKMesser Western Europe(excl. Germany and UK)MesserChina and PeruSource: Goldman Sachs.Note: a. Holding company for the Messer family’s interests.Exhibit 6: Messer Griesheim headcount analysis and employee productivity (Dec 2000–Dec 2003)CAGRTotal Dec-00 toNumber <strong>of</strong> employees Dec-00 Dec-01 Dec-02 Dec-03 Change Dec-03Germany 2,600 2,244 2,208 2,134 (466) (6.4%)North America 1,400 1,163 996 1,093 (307) (7.9%)Western Europe (excluding Germany) 1,100 1,017 997 916 (184) (5.9%)Eastern Europe 2,600 2,369 2,283 2,130 (470) (6.4%)Asia, Africa and Latin America 2,500 1,555 741 871 (1,629) (29.6%)Total Employees 10,200 8,348 7,225 7,144 (3,056) (11.2%)Employee Productivity (in € thousands)Revenue per employee 166 194 211 210 8.0%EBITDA per employee 35 44 56 56 16.9%Capex per employee 32 15 19 18 (17.4%)Source: Goldman Sachs, PF Headcount Analysis, “Messer Griesheim”, 9 July 2007, pp. 13-14, case writers’ research.Notes:2001: During the eight month period ended 31 December 2001, pursuant to the divestiture programme, Messer Griesheim completed disposals <strong>of</strong> theirhome care business in Germany, their health care business in Canada, and their non-cryogenic plant production operations in Germany, the US,Italy and China. Messer Griesheim have also completed disposals <strong>of</strong> their operations in Argentina, Brazil, Mexico, South Africa and South Korea,their nitric oxide business in Germany, and their carbon dioxide business in the US. Messer Griesheim have entered into agreements to sell theiroperations in Trinidad and Tobago.2002: Disposals <strong>of</strong> Messer Griesheim’s home care business in Germany, health care business in Canada and non-cryogenic plant productionoperations in Germany, the US, Italy and China. Messer Griesheim have also completed disposals <strong>of</strong> their operations in Argentina, Brazil,Canada, Egypt, Mexico, South Africa, South Korea, Trinidad and Tobago and Venezuela, their nitric oxide business in Austria, substantially alltheir carbon dioxide business in the US and their nitrogen services business in the UK. As at 31 December 2002, other than the joint venturesin Central America and China and Messer Griesheim’s subsidiaries in Indonesia and Peru, they had completed the divestitures targeted to becompleted by year end 2002. In January 2003, Messer Griesheim sold their operations in Indonesia to PT Tira Austenite Tbk.2003: Pursuant to Messer Griesheim’s divestiture programme, as at 31 December 2003, they had completed disposals <strong>of</strong> their home care businessin Germany, their health care business in Canada, and their non-cryogenic plant production operations in Germany, the US, Italy and China.Messer Griesheim had also completed disposals <strong>of</strong> their operations in Argentina, Brazil, Canada, Egypt, Mexico, South Africa, South Korea,Trinidad and Tobago, Venezuela, Indonesia, Malaysia and Central America, their nitric oxide business in Austria, substantially all their carbondioxide business in the US and their nitrogen services business in the UK.<strong>The</strong> <strong>Global</strong> <strong>Economic</strong> <strong>Impact</strong> <strong>of</strong> <strong>Private</strong> <strong>Equity</strong> <strong>Report</strong> <strong>2008</strong> Case studies: Messer Griesheim 101
- Page 2 and 3:
The Globalization of Alternative In
- Page 5:
ContributorsCo-editorsAnuradha Guru
- Page 9 and 10:
PrefaceKevin SteinbergChief Operati
- Page 11 and 12:
Letter on behalf of the Advisory Bo
- Page 13 and 14:
Executive summaryJosh lernerHarvard
- Page 15 and 16:
• Private equity-backed companies
- Page 17 and 18:
C. Indian casesThe two India cases,
- Page 19 and 20:
Part 1Large-sample studiesThe Globa
- Page 21 and 22:
The new demography of private equit
- Page 23 and 24:
among US publicly traded firms, it
- Page 25 and 26:
should be fairly complete. While th
- Page 27 and 28:
according to Moody’s (Hamilton et
- Page 29 and 30:
draining public markets of firms. I
- Page 31 and 32:
FIguresFigure 1A: LBO transactions
- Page 33 and 34:
TablesTable 1: Capital IQ 1980s cov
- Page 35 and 36:
Table 2: Magnitude and growth of LB
- Page 37 and 38:
Table 4: Exits of individual LBO tr
- Page 39 and 40:
Table 6: Determinants of exit succe
- Page 41 and 42:
Table 7: Ultimate staying power of
- Page 43 and 44:
Appendix 1: Imputed enterprise valu
- Page 45 and 46:
Private equity and long-run investm
- Page 47 and 48:
alternative names associated with t
- Page 49 and 50:
4. Finally, we explore whether firm
- Page 51 and 52:
When we estimate these regressions,
- Page 53 and 54:
cutting back on the number of filin
- Page 55 and 56:
Table 1: Summary statisticsPanel D:
- Page 57 and 58:
Table 4: Relative citation intensit
- Page 59 and 60:
figuresFigure 1: Number of private
- Page 61 and 62:
Private equity and employment*steve
- Page 63 and 64:
Especially when taken together, our
- Page 65 and 66:
centred on the transaction year ide
- Page 67 and 68: and Vartia 1985.) Aggregate employm
- Page 69 and 70: sectors. In Retail Trade, the cumul
- Page 71 and 72: employment-weighted acquisition rat
- Page 73 and 74: FIguresFigure 1: Matches of private
- Page 75 and 76: Figure 6:Figure 6A: Comparison of n
- Page 77 and 78: Figure 8:Figure 8A: Comparison of j
- Page 79 and 80: Figure 11: Variation in impact in e
- Page 81 and 82: Figure 12: Differences in impact on
- Page 83 and 84: Private equity and corporate govern
- Page 85 and 86: et al (2007) track the evolution of
- Page 87 and 88: groups aim to improve firm performa
- Page 89 and 90: distribution of the LBO sponsors, m
- Page 91 and 92: the most difficult cases. This stor
- Page 93 and 94: to see whether these changes of CEO
- Page 95 and 96: Figure 3:This figure represents the
- Page 97 and 98: TablesTable 1: Company size descrip
- Page 99 and 100: Table 5: Changes in the board size,
- Page 101 and 102: Table 7: Board turnoverPanel A: Siz
- Page 103 and 104: Part 2Case studiesThe Global Econom
- Page 105 and 106: European private equity cases: intr
- Page 107 and 108: Exhibit 1: Private equity fund size
- Page 109 and 110: Messer Griesheimann-kristin achleit
- Page 111 and 112: ealized it was not possible to grow
- Page 113 and 114: The deal with Allianz Capital partn
- Page 115 and 116: the deal, the private equity invest
- Page 117: Exhibit 1: The Messer Griesheim dea
- Page 121 and 122: New Lookann-kristin achleitnerTechn
- Page 123 and 124: feet. This restricted store space w
- Page 125 and 126: institutional investors why this in
- Page 127 and 128: Although a public listing did not a
- Page 129 and 130: Exhibit 5: Employment development a
- Page 131 and 132: Chinese private equity cases: intro
- Page 133 and 134: Hony Capital and China Glass Holdin
- Page 135 and 136: Hony’s Chinese name means ambitio
- Page 137 and 138: Establishing early agreement on pos
- Page 139 and 140: Executing the IPOEach of the initia
- Page 141 and 142: Exhibit 1A: Summary of Hony Capital
- Page 143 and 144: Exhibit 4: Members of the China Gla
- Page 145 and 146: Exhibit 6A: China Glass post‐acqu
- Page 147 and 148: Exhibit 8: China Glass stock price
- Page 149 and 150: 3i Group plc and Little Sheep*Lily
- Page 151 and 152: y an aggressive franchise strategy,
- Page 153 and 154: soul” of the business. But there
- Page 155 and 156: Exhibit 1: Summary information on 3
- Page 157 and 158: Exhibit 6: An excerpt from the 180-
- Page 159 and 160: Indian private equity cases: introd
- Page 161 and 162: ICICI Venture and Subhiksha *Lily F
- Page 163 and 164: investment,” recalled Deshpande.
- Page 165 and 166: 2005 - 2007: Moderator, protector a
- Page 167 and 168: Exhibit 3: Subhiksha’s board comp
- Page 169 and 170:
Warburg Pincus and Bharti Tele‐Ve
- Page 171 and 172:
founded two companies at this time
- Page 173 and 174:
By 2003 this restructuring task was
- Page 175 and 176:
Exhibit 1C: Private equity investme
- Page 177 and 178:
Exhibit 4B: Bharti cellular footpri
- Page 179 and 180:
Exhibit 6: Summary of Bharti’s fi
- Page 181 and 182:
Exhibit 7: Bharti’s board structu
- Page 183 and 184:
In the 1993‐94 academic year, he
- Page 185 and 186:
consumer products. She was also a R
- Page 187 and 188:
AcknowledgementsJosh LernerHarvard
- Page 189:
The World Economic Forum is an inde