TablesTable 7: Ultimate staying power <strong>of</strong> LBOs: Transition <strong>of</strong> firms out <strong>of</strong> LBO ownershipTable 7A: By the year <strong>of</strong> the original LBO transactionNumber <strong>of</strong> original LBO transactionsAll LBO firmsFraction <strong>of</strong> original LBO transactions1970- 1985- 1990- 1995- 2000- 2003- 2006- 1970- 1970- 1985- 1990- 1995- 2000- 2003- 2006- 1970-1984 1989 1994 1999 2002 2005 2007 2007 1984 1989 1994 1999 2002 2005 2007 2007Acquired bystrategic buyer 65 243 436 1,361 745 540 36 3,426 32% 38% 39% 31% 19% 10% 1% 18%Independent privatecompany 51 116 138 379 183 107 25 999 25% 18% 12% 9% 5% 2% 1% 5%Still in LBOownership form 15 73 224 2,028 2,708 4,550 3,815 13,413 7% 11% 20% 46% 69% 85% 98% 69%Bankrupt/restruct. 13 46 62 270 119 58 2 570 6% 7% 6% 6% 3% 1% 0% 3%Went public 59 167 253 407 155 126 0 1,167 29% 26% 23% 9% 4% 2% 0% 6%203 645 1,113 4,445 3,910 5,381 3,878 19,575 100% 100% 100% 100% 100% 100% 100% 100%Backed by PE fundAcquired bystrategic buyer 62 238 424 1,331 610 429 23 3,117 32% 38% 39% 32% 22% 11% 1% 20%Independentprivate company 51 115 137 366 171 84 19 943 26% 18% 13% 9% 6% 2% 1% 6%Still in LBOownership form 12 68 215 1,807 1,719 3,205 2,878 9,904 6% 11% 20% 43% 63% 83% 98% 63%Bankrupt/restruct. 13 44 61 260 91 38 2 509 7% 7% 6% 6% 3% 1% 0% 3%Went public 58 163 252 392 145 117 0 1127 30% 26% 23% 9% 5% 3% 0% 7%196 628 1,089 4,156 2,736 3,873 2,922 15,600 100% 100% 100% 100% 100% 100% 100% 100%No financial sponsor / “Pure” MBOAcquired bystrategic buyer 3 5 12 30 135 111 13 309 43% 29% 50% 10% 11% 7% 1% 8%Independent privatecompany 0 1 1 13 12 23 6 56 0% 6% 4% 4% 1% 2% 1% 1%Still in LBOownership form 3 5 9 221 989 1345 937 3,509 43% 29% 38% 76% 84% 89% 98% 88%Bankrupt/restruct. 0 2 1 10 28 20 0 61 0% 12% 4% 3% 2% 1% 0% 2%Went public 1 4 1 15 10 9 0 40 14% 24% 4% 5% 1% 1% 0% 1%7 17 24 289 1,174 1,508 956 3,975 100% 100% 100% 100% 100% 100% 100% 100%Table 7B: By the type <strong>of</strong> the original LBO transaction (1970–2002 transactions only)By LBO typeAll Public <strong>Private</strong> AllPubl. to <strong>Private</strong> to Financial LBO to to Financial LBOprivate private Division vendor Distress types private private Division vendor Distress typesAcquired bystrategic buyer 124 1,619 757 61 42 2,603 22% 29% 31% 26% 30% 29%Independent privatecompany 30 645 126 14 15 830 5% 12% 5% 6% 11% 9%Went bankrupt 37 316 93 19 15 480 7% 6% 4% 8% 11% 6%Went public 72 604 282 21 12 991 13% 11% 12% 9% 8% 11%Still in LBOownership form 302 2,307 1,176 116 58 3,959 53% 42% 48% 50% 41% 45%All exits 565 5,491 2,434 231 142 8,863 100% 100% 100% 100% 100% 100%22 Large-sample studies: Demography<strong>The</strong> <strong>Global</strong> <strong>Economic</strong> <strong>Impact</strong> <strong>of</strong> <strong>Private</strong> <strong>Equity</strong> <strong>Report</strong> <strong>2008</strong>
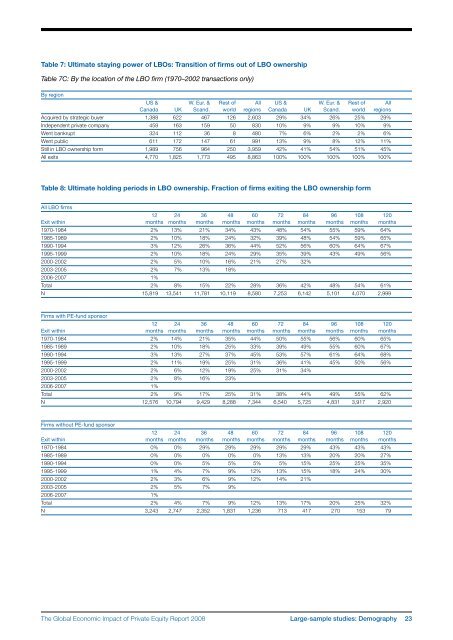
Table 7: Ultimate staying power <strong>of</strong> LBOs: Transition <strong>of</strong> firms out <strong>of</strong> LBO ownershipTable 7C: By the location <strong>of</strong> the LBO firm (1970–2002 transactions only)By regionUS & W. Eur. & Rest <strong>of</strong> All US & W. Eur. & Rest <strong>of</strong> AllCanada UK Scand. world regions Canada UK Scand. world regionsAcquired by strategic buyer 1,388 622 467 126 2,603 29% 34% 26% 25% 29%Independent private company 458 163 159 50 830 10% 9% 9% 10% 9%Went bankrupt 324 112 36 8 480 7% 6% 2% 2% 6%Went public 611 172 147 61 991 13% 9% 8% 12% 11%Still in LBO ownership form 1,989 756 964 250 3,959 42% 41% 54% 51% 45%All exits 4,770 1,825 1,773 495 8,863 100% 100% 100% 100% 100%Table 8: Ultimate holding periods in LBO ownership. Fraction <strong>of</strong> firms exiting the LBO ownership formAll LBO firms12 24 36 48 60 72 84 96 108 120Exit within months months months months months months months months months months1970-1984 2% 13% 21% 34% 43% 48% 54% 55% 59% 64%1985-1989 2% 10% 18% 24% 32% 39% 48% 54% 59% 65%1990-1994 3% 12% 26% 36% 44% 52% 56% 60% 64% 67%1995-1999 2% 10% 18% 24% 29% 35% 39% 43% 49% 56%2000-2002 2% 5% 10% 16% 21% 27% 32%2003-2005 2% 7% 13% 18%2006-2007 1%Total 2% 8% 15% 22% 28% 36% 42% 48% 54% 61%N 15,819 13,541 11,781 10,119 8,580 7,253 6,142 5,101 4,070 2,999Firms with PE-fund sponsor12 24 36 48 60 72 84 96 108 120Exit within months months months months months months months months months months1970-1984 2% 14% 21% 35% 44% 50% 55% 56% 60% 65%1985-1989 2% 10% 18% 25% 33% 39% 49% 55% 60% 67%1990-1994 3% 13% 27% 37% 45% 53% 57% 61% 64% 68%1995-1999 2% 11% 19% 25% 31% 36% 41% 45% 50% 56%2000-2002 2% 6% 12% 19% 25% 31% 34%2003-2005 2% 8% 16% 23%2006-2007 1%Total 2% 9% 17% 25% 31% 38% 44% 49% 55% 62%N 12,576 10,794 9,429 8,288 7,344 6,540 5,725 4,831 3,917 2,920Firms without PE-fund sponsor12 24 36 48 60 72 84 96 108 120Exit within months months months months months months months months months months1970-1984 0% 0% 29% 29% 29% 29% 29% 43% 43% 43%1985-1989 0% 0% 0% 0% 0% 13% 13% 20% 20% 27%1990-1994 0% 0% 5% 5% 5% 5% 15% 25% 25% 35%1995-1999 1% 4% 7% 9% 12% 13% 15% 18% 24% 30%2000-2002 2% 3% 6% 9% 12% 14% 21%2003-2005 2% 5% 7% 9%2006-2007 1%Total 2% 4% 7% 9% 12% 13% 17% 20% 25% 32%N 3,243 2,747 2,352 1,831 1,236 713 417 270 153 79<strong>The</strong> <strong>Global</strong> <strong>Economic</strong> <strong>Impact</strong> <strong>of</strong> <strong>Private</strong> <strong>Equity</strong> <strong>Report</strong> <strong>2008</strong> Large-sample studies: Demography 23
- Page 2 and 3: The Globalization of Alternative In
- Page 5: ContributorsCo-editorsAnuradha Guru
- Page 9 and 10: PrefaceKevin SteinbergChief Operati
- Page 11 and 12: Letter on behalf of the Advisory Bo
- Page 13 and 14: Executive summaryJosh lernerHarvard
- Page 15 and 16: • Private equity-backed companies
- Page 17 and 18: C. Indian casesThe two India cases,
- Page 19 and 20: Part 1Large-sample studiesThe Globa
- Page 21 and 22: The new demography of private equit
- Page 23 and 24: among US publicly traded firms, it
- Page 25 and 26: should be fairly complete. While th
- Page 27 and 28: according to Moody’s (Hamilton et
- Page 29 and 30: draining public markets of firms. I
- Page 31 and 32: FIguresFigure 1A: LBO transactions
- Page 33 and 34: TablesTable 1: Capital IQ 1980s cov
- Page 35 and 36: Table 2: Magnitude and growth of LB
- Page 37 and 38: Table 4: Exits of individual LBO tr
- Page 39: Table 6: Determinants of exit succe
- Page 43 and 44: Appendix 1: Imputed enterprise valu
- Page 45 and 46: Private equity and long-run investm
- Page 47 and 48: alternative names associated with t
- Page 49 and 50: 4. Finally, we explore whether firm
- Page 51 and 52: When we estimate these regressions,
- Page 53 and 54: cutting back on the number of filin
- Page 55 and 56: Table 1: Summary statisticsPanel D:
- Page 57 and 58: Table 4: Relative citation intensit
- Page 59 and 60: figuresFigure 1: Number of private
- Page 61 and 62: Private equity and employment*steve
- Page 63 and 64: Especially when taken together, our
- Page 65 and 66: centred on the transaction year ide
- Page 67 and 68: and Vartia 1985.) Aggregate employm
- Page 69 and 70: sectors. In Retail Trade, the cumul
- Page 71 and 72: employment-weighted acquisition rat
- Page 73 and 74: FIguresFigure 1: Matches of private
- Page 75 and 76: Figure 6:Figure 6A: Comparison of n
- Page 77 and 78: Figure 8:Figure 8A: Comparison of j
- Page 79 and 80: Figure 11: Variation in impact in e
- Page 81 and 82: Figure 12: Differences in impact on
- Page 83 and 84: Private equity and corporate govern
- Page 85 and 86: et al (2007) track the evolution of
- Page 87 and 88: groups aim to improve firm performa
- Page 89 and 90: distribution of the LBO sponsors, m
- Page 91 and 92:
the most difficult cases. This stor
- Page 93 and 94:
to see whether these changes of CEO
- Page 95 and 96:
Figure 3:This figure represents the
- Page 97 and 98:
TablesTable 1: Company size descrip
- Page 99 and 100:
Table 5: Changes in the board size,
- Page 101 and 102:
Table 7: Board turnoverPanel A: Siz
- Page 103 and 104:
Part 2Case studiesThe Global Econom
- Page 105 and 106:
European private equity cases: intr
- Page 107 and 108:
Exhibit 1: Private equity fund size
- Page 109 and 110:
Messer Griesheimann-kristin achleit
- Page 111 and 112:
ealized it was not possible to grow
- Page 113 and 114:
The deal with Allianz Capital partn
- Page 115 and 116:
the deal, the private equity invest
- Page 117 and 118:
Exhibit 1: The Messer Griesheim dea
- Page 119 and 120:
Exhibit 5: Post buyout structureMes
- Page 121 and 122:
New Lookann-kristin achleitnerTechn
- Page 123 and 124:
feet. This restricted store space w
- Page 125 and 126:
institutional investors why this in
- Page 127 and 128:
Although a public listing did not a
- Page 129 and 130:
Exhibit 5: Employment development a
- Page 131 and 132:
Chinese private equity cases: intro
- Page 133 and 134:
Hony Capital and China Glass Holdin
- Page 135 and 136:
Hony’s Chinese name means ambitio
- Page 137 and 138:
Establishing early agreement on pos
- Page 139 and 140:
Executing the IPOEach of the initia
- Page 141 and 142:
Exhibit 1A: Summary of Hony Capital
- Page 143 and 144:
Exhibit 4: Members of the China Gla
- Page 145 and 146:
Exhibit 6A: China Glass post‐acqu
- Page 147 and 148:
Exhibit 8: China Glass stock price
- Page 149 and 150:
3i Group plc and Little Sheep*Lily
- Page 151 and 152:
y an aggressive franchise strategy,
- Page 153 and 154:
soul” of the business. But there
- Page 155 and 156:
Exhibit 1: Summary information on 3
- Page 157 and 158:
Exhibit 6: An excerpt from the 180-
- Page 159 and 160:
Indian private equity cases: introd
- Page 161 and 162:
ICICI Venture and Subhiksha *Lily F
- Page 163 and 164:
investment,” recalled Deshpande.
- Page 165 and 166:
2005 - 2007: Moderator, protector a
- Page 167 and 168:
Exhibit 3: Subhiksha’s board comp
- Page 169 and 170:
Warburg Pincus and Bharti Tele‐Ve
- Page 171 and 172:
founded two companies at this time
- Page 173 and 174:
By 2003 this restructuring task was
- Page 175 and 176:
Exhibit 1C: Private equity investme
- Page 177 and 178:
Exhibit 4B: Bharti cellular footpri
- Page 179 and 180:
Exhibit 6: Summary of Bharti’s fi
- Page 181 and 182:
Exhibit 7: Bharti’s board structu
- Page 183 and 184:
In the 1993‐94 academic year, he
- Page 185 and 186:
consumer products. She was also a R
- Page 187 and 188:
AcknowledgementsJosh LernerHarvard
- Page 189:
The World Economic Forum is an inde