

The Global Economic Impact of Private Equity Report 2008 - World ...
The Global Economic Impact of Private Equity Report 2008 - World ...
The Global Economic Impact of Private Equity Report 2008 - World ...
- No tags were found...

Create successful ePaper yourself
Turn your PDF publications into a flip-book with our unique Google optimized e-Paper software.
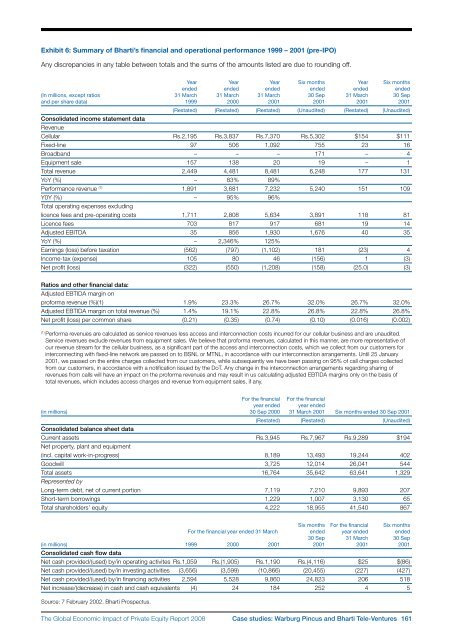
Exhibit 6: Summary <strong>of</strong> Bharti’s financial and operational performance 1999 – 2001 (pre-IPO)Any discrepancies in any table between totals and the sums <strong>of</strong> the amounts listed are due to rounding <strong>of</strong>f.Year Year Year Six months Year Six monthsended ended ended ended ended ended(In millions, except ratios 31 March 31 March 31 March 30 Sep 31 March 30 Sepand per share data) 1999 2000 2001 2001 2001 2001(Restated) (Restated) (Restated) (Unaudited) (Restated) (Unaudited)Consolidated income statement dataRevenueCellular Rs.2,195 Rs.3,837 Rs.7,370 Rs.5,302 $154 $111Fixed-line 97 506 1,092 755 23 16Broadband – – – 171 – 4Equipment sale 157 138 20 19 – 1Total revenue 2,449 4,481 8,481 6,248 177 131YoY (%) – 83% 89%Performance revenue (1) 1,891 3,681 7,232 5,240 151 109Y0Y (%) – 95% 96%Total operating expenses excludinglicence fees and pre-operating costs 1,711 2,808 5,634 3,891 118 81Licence fees 703 817 917 681 19 14Adjusted EBITDA 35 856 1,930 1,676 40 35YoY (%) – 2,346% 125%Earnings (loss) before taxation (562) (797) (1,102) 181 (23) 4Income-tax (expense) 105 80 46 (156) 1 (3)Net pr<strong>of</strong>it (loss) (322) (550) (1,208) (158) (25.0) (3)Ratios and other financial data:Adjusted EBTIDA margin onpr<strong>of</strong>orma revenue (%)(1) 1.9% 23.3% 26.7% 32.0% 26.7% 32.0%Adjusted EBTIDA margin on total revenue (%) 1.4% 19.1% 22.8% 26.8% 22.8% 26.8%Net pr<strong>of</strong>it (loss) per common share (0.21) (0.35) (0.74) (0.10) (0.016) (0.002)(1) Performa revenues are calculated as service revenues less access and interconnection costs incurred for our cellular business and are unaudited.Service revenues exclude revenues from equipment sales. We believe that pr<strong>of</strong>orma revenues, calculated in this manner, are more representative <strong>of</strong>our revenue stream for the cellular business, as a significant part <strong>of</strong> the access and interconnection costs, which we collect from our customers forinterconnecting with fixed-line network are passed on to BSNL or MTNL, in accordance with our interconnection arrangements. Until 25 January2001, we passed on the entire charges collected from our customers, while subsequently we have been passing on 95% <strong>of</strong> call charges collectedfrom our customers, in accordance with a notification issued by the DoT. Any change in the interconnection arrangements regarding sharing <strong>of</strong>revenues from calls will have an impact on the pr<strong>of</strong>orma revenues and may result in us calculating adjusted EBTIDA margins only on the basis <strong>of</strong>total revenues, which includes access charges and revenue from equipment sales, if any.For the financial For the financialyear ended year ended(in millions) 30 Sep 2000 31 March 2001 Six months ended 30 Sep 2001(Restated) (Restated) (Unaudited)Consolidated balance sheet dataCurrent assets Rs.3,945 Rs.7,967 Rs.9,289 $194Net property, plant and equipment(incl. capital work-in-progress) 8,189 13,493 19,244 402Goodwill 3,725 12,014 26,041 544Total assets 16,764 35,642 63,641 1,329Represented byLong-term debt, net <strong>of</strong> current portion 7,119 7,210 9,893 207Short-term borrowings 1,229 1,007 3,130 65Total shareholders’ equity 4,222 18,955 41,540 867Six months For the financial Six monthsFor the financial year ended 31 March ended year ended ended30 Sep 31 March 30 Sep(in millions) 1999 2000 2001 2001 2001 2001Consolidated cash flow dataNet cash provided/(used) by/in operating activites Rs.1,059 Rs.(1,905) Rs.1,190 Rs.(4,116) $25 $(86)Net cash provided/(used) by/in investing activities (3,656) (3,599) (10,866) (20,455) (227) (427)Net cash provided/(used) by/in financing activities 2,594 5,528 9,860 24,823 206 518Net increase/(decrease) in cash and cash equivalents (4) 24 184 252 4 5Source: 7 February 2002. Bharti Prospectus.<strong>The</strong> <strong>Global</strong> <strong>Economic</strong> <strong>Impact</strong> <strong>of</strong> <strong>Private</strong> <strong>Equity</strong> <strong>Report</strong> <strong>2008</strong> Case studies: Warburg Pincus and Bharti Tele‐Ventures 161


