

The Global Economic Impact of Private Equity Report 2008 - World ...
The Global Economic Impact of Private Equity Report 2008 - World ...
The Global Economic Impact of Private Equity Report 2008 - World ...
- No tags were found...

You also want an ePaper? Increase the reach of your titles
YUMPU automatically turns print PDFs into web optimized ePapers that Google loves.
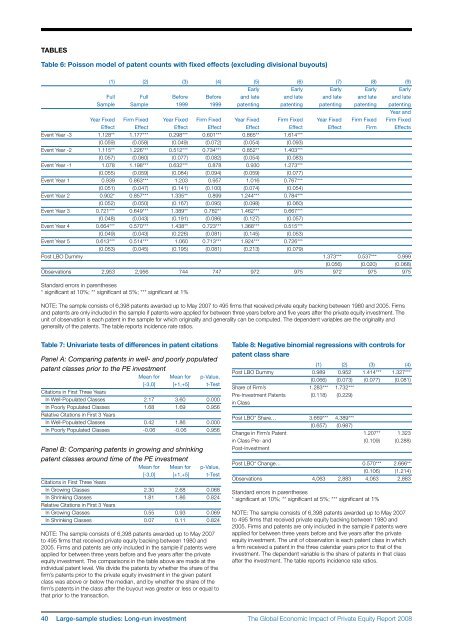
tablesTable 6: Poisson model <strong>of</strong> patent counts with fixed effects (excluding divisional buyouts)(1) (2) (3) (4) (5) (6) (7) (8) (9)Early Early Early Early EarlyFull Full Before Before and late and late and late and late and lateSample Sample 1999 1999 patenting patenting patenting patenting patentingYear andYear Fixed Firm Fixed Year Fixed Firm Fixed Year Fixed Firm Fixed Year Fixed Firm Fixed Firm FixedEffect Effect Effect Effect Effect Effect Effect Firm EffectsEvent Year -3 1.128** 1.177*** 0.298*** 0.601*** 0.865** 1.614***(0.059) (0.058) (0.049) (0.072) (0.054) (0.093)Event Year -2 1.115** 1.226*** 0.512*** 0.734*** 0.852** 1.403***(0.057) (0.060) (0.077) (0.082) (0.054) (0.083)Event Year -1 1.078 1.198*** 0.632*** 0.878 0.930 1.273***(0.055) (0.059) (0.084) (0.094) (0.059) (0.077)Event Year 1 0.939 0.863*** 1.203 0.957 1.016 0.767***(0.051) (0.047) (0.141) (0.100) (0.074) (0.054)Event Year 2 0.902* 0.857*** 1.335** 0.899 1.244*** 0.784***(0.052) (0.050) (0.167) (0.095) (0.098) (0.060)Event Year 3 0.721*** 0.649*** 1.389** 0.782** 1.462*** 0.667***(0.048) (0.043) (0.191) (0.086) (0.127) (0.057)Event Year 4 0.664*** 0.570*** 1.438** 0.723*** 1.368*** 0.515***(0.049) (0.043) (0.226) (0.081) (0.145) (0.053)Event Year 5 0.613*** 0.514*** 1.060 0.713*** 1.924*** 0.726***(0.053) (0.045) (0.195) (0.081) (0.213) (0.079)Post LBO Dummy 1.373*** 0.537*** 0.999(0.056) (0.020) (0.068)Observations 2,953 2,956 744 747 972 975 972 975 975Standard errors in parentheses* significant at 10%; ** significant at 5%; *** significant at 1%NOTE: <strong>The</strong> sample consists <strong>of</strong> 6,398 patents awarded up to May 2007 to 495 firms that received private equity backing between 1980 and 2005. Firmsand patents are only included in the sample if patents were applied for between three years before and five years after the private equity investment. <strong>The</strong>unit <strong>of</strong> observation is each patent in the sample for which originality and generality can be computed. <strong>The</strong> dependent variables are the originality andgenerality <strong>of</strong> the patents. <strong>The</strong> table reports incidence rate ratios.Table 7: Univariate tests <strong>of</strong> differences in patent citationsPanel A: Comparing patents in well- and poorly populatedpatent classes prior to the PE investmentMean for Mean for p-Value,[-3,0] [+1,+5] t-TestCitations in First Three YearsIn Well-Populated Classes 2.17 3.60 0.000In Poorly Populated Classes 1.68 1.69 0.956Relative Citations in First 3 YearsIn Well-Populated Classes 0.42 1.86 0.000In Poorly Populated Classes ‐0.06 -0.06 0.956Panel B: Comparing patents in growing and shrinkingpatent classes around time <strong>of</strong> the PE investmentMean for Mean for p-Value,[-3,0] [+1,+5] t-TestCitations in First Three YearsIn Growing Classes 2.30 2.68 0.068In Shrinking Classes 1.81 1.86 0.824Relative Citations in First 3 YearsIn Growing Classes 0.55 0.93 0.069In Shrinking Classes 0.07 0.11 0.824NOTE: <strong>The</strong> sample consists <strong>of</strong> 6,398 patents awarded up to May 2007to 495 firms that received private equity backing between 1980 and2005. Firms and patents are only included in the sample if patents wereapplied for between three years before and five years after the privateequity investment. <strong>The</strong> comparisons in the table above are made at theindividual patent level. We divide the patents by whether the share <strong>of</strong> thefirm’s patents prior to the private equity investment in the given patentclass was above or below the median, and by whether the share <strong>of</strong> thefirm’s patents in the class after the buyout was greater or less or equal tothat prior to the transaction.Table 8: Negative binomial regressions with controls forpatent class share(1) (2) (3) (4)Post LBO Dummy 0.989 0.952 1.414*** 1.327***(0.066) (0.073) (0.077) (0.081)Share <strong>of</strong> Firm’s 1.283*** 1.732***Pre-Investment Patents (0.118) (0.229)in ClassPost LBO* Share… 3.669*** 4.389***(0.657) (0.987)Change in Firm’s Patent 1.207** 1.323in Class Pre- and (0.109) (0.288)Post-InvestmentPost LBO* Change… 0.570*** 2.666**(0.106) (1.214)Observations 4,063 2,883 4,063 2,883Standard errors in parentheses* significant at 10%; ** significant at 5%; *** significant at 1%NOTE: <strong>The</strong> sample consists <strong>of</strong> 6,398 patents awarded up to May 2007to 495 firms that received private equity backing between 1980 and2005. Firms and patents are only included in the sample if patents wereapplied for between three years before and five years after the privateequity investment. <strong>The</strong> unit <strong>of</strong> observation is each patent class in whicha firm received a patent in the three calendar years prior to that <strong>of</strong> theinvestment. <strong>The</strong> dependent variable is the share <strong>of</strong> patents in that classafter the investment. <strong>The</strong> table reports incidence rate ratios.40 Large-sample studies: Long-run investment<strong>The</strong> <strong>Global</strong> <strong>Economic</strong> <strong>Impact</strong> <strong>of</strong> <strong>Private</strong> <strong>Equity</strong> <strong>Report</strong> <strong>2008</strong>


