The Global Economic Impact of Private Equity Report 2008 - World ...
The Global Economic Impact of Private Equity Report 2008 - World ...
The Global Economic Impact of Private Equity Report 2008 - World ...
- No tags were found...
You also want an ePaper? Increase the reach of your titles
YUMPU automatically turns print PDFs into web optimized ePapers that Google loves.
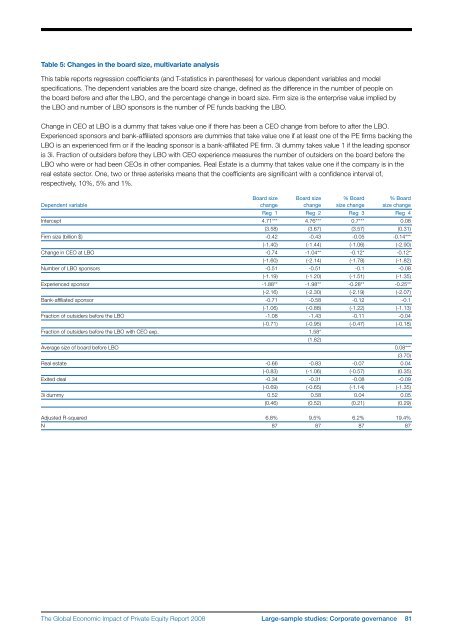
Table 5: Changes in the board size, multivariate analysisThis table reports regression coefficients (and T‐statistics in parentheses) for various dependent variables and modelspecifications. <strong>The</strong> dependent variables are the board size change, defined as the difference in the number <strong>of</strong> people onthe board before and after the LBO, and the percentage change in board size. Firm size is the enterprise value implied bythe LBO and number <strong>of</strong> LBO sponsors is the number <strong>of</strong> PE funds backing the LBO.Change in CEO at LBO is a dummy that takes value one if there has been a CEO change from before to after the LBO.Experienced sponsors and bank-affiliated sponsors are dummies that take value one if at least one <strong>of</strong> the PE firms backing theLBO is an experienced firm or if the leading sponsor is a bank-affiliated PE firm. 3i dummy takes value 1 if the leading sponsoris 3i. Fraction <strong>of</strong> outsiders before they LBO with CEO experience measures the number <strong>of</strong> outsiders on the board before theLBO who were or had been CEOs in other companies. Real Estate is a dummy that takes value one if the company is in thereal estate sector. One, two or three asterisks means that the coefficients are significant with a confidence interval <strong>of</strong>,respectively, 10%, 5% and 1%.Board size Board size % Board % BoardDependent variable change change size change size changeReg 1 Reg 2 Reg 3 Reg 4Intercept 4.71*** 4.76*** 0.7*** 0.08(3.58) (3.67) (3.57) (0.31)Firm size (billion $) ‐0.42 ‐0.43 ‐0.05 ‐0.14***(-1.40) (-1.44) (-1.06) (-2.90)Change in CEO at LBO ‐0.74 -1.04** ‐0.12* ‐0.12*(-1.60) (-2.14) (-1.78) (-1.82)Number <strong>of</strong> LBO sponsors ‐0.51 ‐0.51 ‐0.1 ‐0.08(-1.19) (-1.20) (-1.51) (-1.35)Experienced sponsor -1.88** -1.98** -0.28** ‐0.25**(-2.16) (-2.30) (-2.19) (-2.07)Bank-affiliated sponsor ‐0.71 ‐0.58 ‐0.12 ‐0.1(-1.06) (-0.88) (-1.22) (-1.13)Fraction <strong>of</strong> outsiders before the LBO - ‐1.08 ‐1.43 ‐0.11 ‐0.04(-0.71) (-0.95) (-0.47) (-0.18)Fraction <strong>of</strong> outsiders before the LBO with CEO exp. 1.58*(1.82)Average size <strong>of</strong> board before LBO 0.08***(3.70)Real estate ‐0.66 ‐0.83 ‐0.07 0.04(-0.83) (-1.06) (-0.57) (0.35)Exited deal ‐0.34 ‐0.31 ‐0.08 ‐0.09(-0.69) (-0.65) (-1.14) (-1.35)3i dummy 0.52 0.58 0.04 0.05(0.46) (0.52) (0.21) (0.29)Adjusted R-squared 6.8% 9.5% 6.2% 19.4%N 87 87 87 87<strong>The</strong> <strong>Global</strong> <strong>Economic</strong> <strong>Impact</strong> <strong>of</strong> <strong>Private</strong> <strong>Equity</strong> <strong>Report</strong> <strong>2008</strong> Large-sample studies: Corporate governance 81


