

The Global Economic Impact of Private Equity Report 2008 - World ...
The Global Economic Impact of Private Equity Report 2008 - World ...
The Global Economic Impact of Private Equity Report 2008 - World ...
- No tags were found...

You also want an ePaper? Increase the reach of your titles
YUMPU automatically turns print PDFs into web optimized ePapers that Google loves.
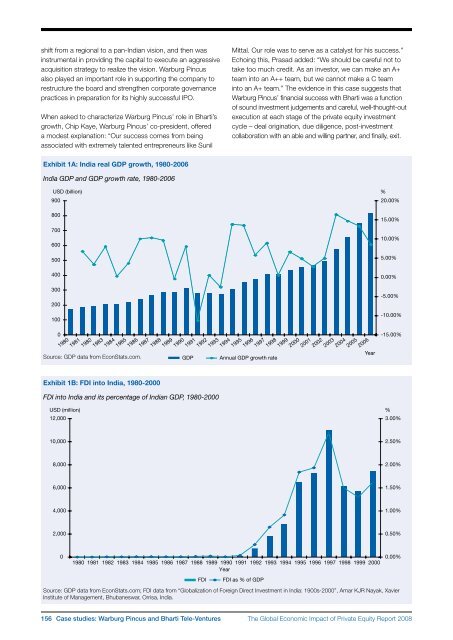
shift from a regional to a pan‐Indian vision, and then wasinstrumental in providing the capital to execute an aggressiveacquisition strategy to realize the vision. Warburg Pincusalso played an important role in supporting the company torestructure the board and strengthen corporate governancepractices in preparation for its highly successful IPO.When asked to characterize Warburg Pincus’ role in Bharti’sgrowth, Chip Kaye, Warburg Pincus’ co‐president, <strong>of</strong>fereda modest explanation: “Our success comes from beingassociated with extremely talented entrepreneurs like SunilMittal. Our role was to serve as a catalyst for his success.”Echoing this, Prasad added: “We should be careful not totake too much credit. As an investor, we can make an A+team into an A++ team, but we cannot make a C teaminto an A+ team.” <strong>The</strong> evidence in this case suggests thatWarburg Pincus’ financial success with Bharti was a function<strong>of</strong> sound investment judgements and careful, well-thought‐outexecution at each stage <strong>of</strong> the private equity investmentcycle – deal origination, due diligence, post‐investmentcollaboration with an able and willing partner, and finally, exit.Exhibit 1A: India real GDP growth, 1980-2006India GDP and GDP growth rate, 1980-2006USD (billion) %90020.00%80015.00%70060010.00%5005.00%4000.00%3002001000Source: GDP data from EconStats.com.19801981198219831984198519861987198819891990Exhibit 1B: FDI into India, 1980-20001991GDPFDI into India and its percentage <strong>of</strong> Indian GDP, 1980-20001992199319941995Annual GDP growth rate19961997199819992000200120022003200420052006Year-5.00%-10.00%-15.00%USD (million)12,000%3.00%10,0002.50%8,0002.00%6,0001.50%4,0001.00%2,0000.50%01980 1981 1982 1983 1984 1985 1986 1987 1988 1989 1990 1991 1992 1993 1994 1995 1996 1997 1998 1999 2000YearFDIFDI as % <strong>of</strong> GDPSource: GDP data from EconStats.com; FDI data from “<strong>Global</strong>ization <strong>of</strong> Foreign Direct Investment in India: 1900s-2000”, Amar KJR Nayak, XavierInstitute <strong>of</strong> Management, Bhubaneswar, Orrisa, India.0.00%156 Case studies: Warburg Pincus and Bharti Tele‐Ventures<strong>The</strong> <strong>Global</strong> <strong>Economic</strong> <strong>Impact</strong> <strong>of</strong> <strong>Private</strong> <strong>Equity</strong> <strong>Report</strong> <strong>2008</strong>


