

The Global Economic Impact of Private Equity Report 2008 - World ...
The Global Economic Impact of Private Equity Report 2008 - World ...
The Global Economic Impact of Private Equity Report 2008 - World ...
- No tags were found...

Create successful ePaper yourself
Turn your PDF publications into a flip-book with our unique Google optimized e-Paper software.
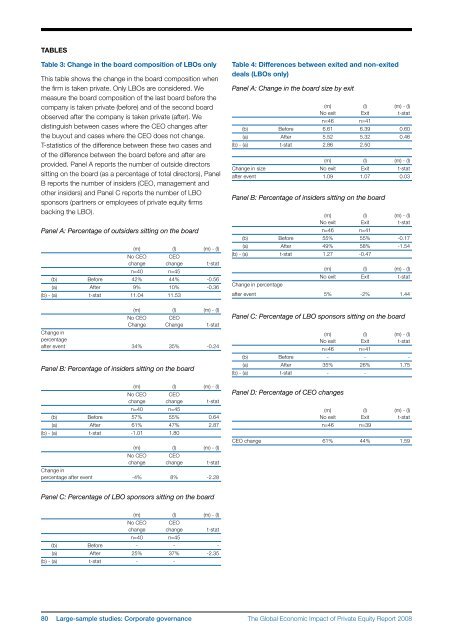
TablesTable 3: Change in the board composition <strong>of</strong> LBOs onlyThis table shows the change in the board composition whenthe firm is taken private. Only LBOs are considered. Wemeasure the board composition <strong>of</strong> the last board before thecompany is taken private (before) and <strong>of</strong> the second boardobserved after the company is taken private (after). Wedistinguish between cases where the CEO changes afterthe buyout and cases where the CEO does not change.T‐statistics <strong>of</strong> the difference between these two cases and<strong>of</strong> the difference between the board before and after areprovided. Panel A reports the number <strong>of</strong> outside directorssitting on the board (as a percentage <strong>of</strong> total directors), PanelB reports the number <strong>of</strong> insiders (CEO, management andother insiders) and Panel C reports the number <strong>of</strong> LBOsponsors (partners or employees <strong>of</strong> private equity firmsbacking the LBO).Panel A: Percentage <strong>of</strong> outsiders sitting on the board(m) (l) (m) - (l)No CEO CEOchange change t-statn=40 n=45(b) Before 42% 44% -0.56(a) After 9% 10% -0.36(b) - (a) t-stat 11.04 11.53(m) (l) (m) - (l)No CEO CEOChange Change t-statChange inpercentageafter event 34% 35% -0.24Panel B: Percentage <strong>of</strong> insiders sitting on the board(m) (l) (m) - (l)No CEO CEOchange change t-statn=40 n=45(b) Before 57% 55% 0.64(a) After 61% 47% 2.87(b) - (a) t-stat ‐1.01 1.80(m) (l) (m) - (l)No CEO CEOchange change t-statChange inpercentage after event - ‐4% 8% ‐2.28Table 4: Differences between exited and non‐exiteddeals (LBOs only)Panel A: Change in the board size by exit(m) (l) (m) - (l)No exit Exit t-statn=46 n=41(b) Before 6.61 6.39 0.60(a) After 5.52 5.32 0.46(b) - (a) t-stat 2.86 2.50(m) (l) (m) - (l)Change in size No exit Exit t-statafter event 1.09 1.07 0.03Panel B: Percentage <strong>of</strong> insiders sitting on the board(m) (l) (m) - (l)No exit Exit t-statn=46 n=41(b) Before 55% 55% -0.17(a) After 49% 58% -1.54(b) - (a) t-stat 1.27 -0.47Change in percentage(m) (l) (m) - (l)No exit Exit t-statafter event 5% ‐2% 1.44Panel C: Percentage <strong>of</strong> LBO sponsors sitting on the board(m) (l) (m) - (l)No exit Exit t-statn=46 n=41(b) Before ‐ ‐ ‐(a) After 35% 26% 1.75(b) - (a) t-stat ‐ ‐Panel D: Percentage <strong>of</strong> CEO changes(m) (l) (m) - (l)No exit Exit t-statn=46 n=39CEO change 61% 44% 1.59Panel C: Percentage <strong>of</strong> LBO sponsors sitting on the board(m) (l) (m) - (l)No CEO CEOchange change t-statn=40 n=45(b) Before ‐ ‐ ‐(a) After 25% 37% -2.35(b) - (a) t-stat ‐ ‐80 Large-sample studies: Corporate governance<strong>The</strong> <strong>Global</strong> <strong>Economic</strong> <strong>Impact</strong> <strong>of</strong> <strong>Private</strong> <strong>Equity</strong> <strong>Report</strong> <strong>2008</strong>


